Practical Applications of Velocity-Based Training
Available in:
EN
Velocity-based training (VBT) is a feedback tool that uses movement velocity during resistance training to provide objective information about how an athlete is performing against a given external load.
While VBT can provide a range of metrics and applications, many are built on a core training principle: the load-velocity relationship. This principle states that, for a given activity, as external load increases, movement velocity decreases.
Understanding this relationship provides the foundation for using VBT to prescribe training intensity, monitor performance changes and estimate maximal strength without requiring frequent maximal testing.
[The load-velocity] relationship provides the foundation for using VBT to prescribe training intensity, monitor performance changes and estimate maximal strength…
Understanding the Load-Velocity Relationship
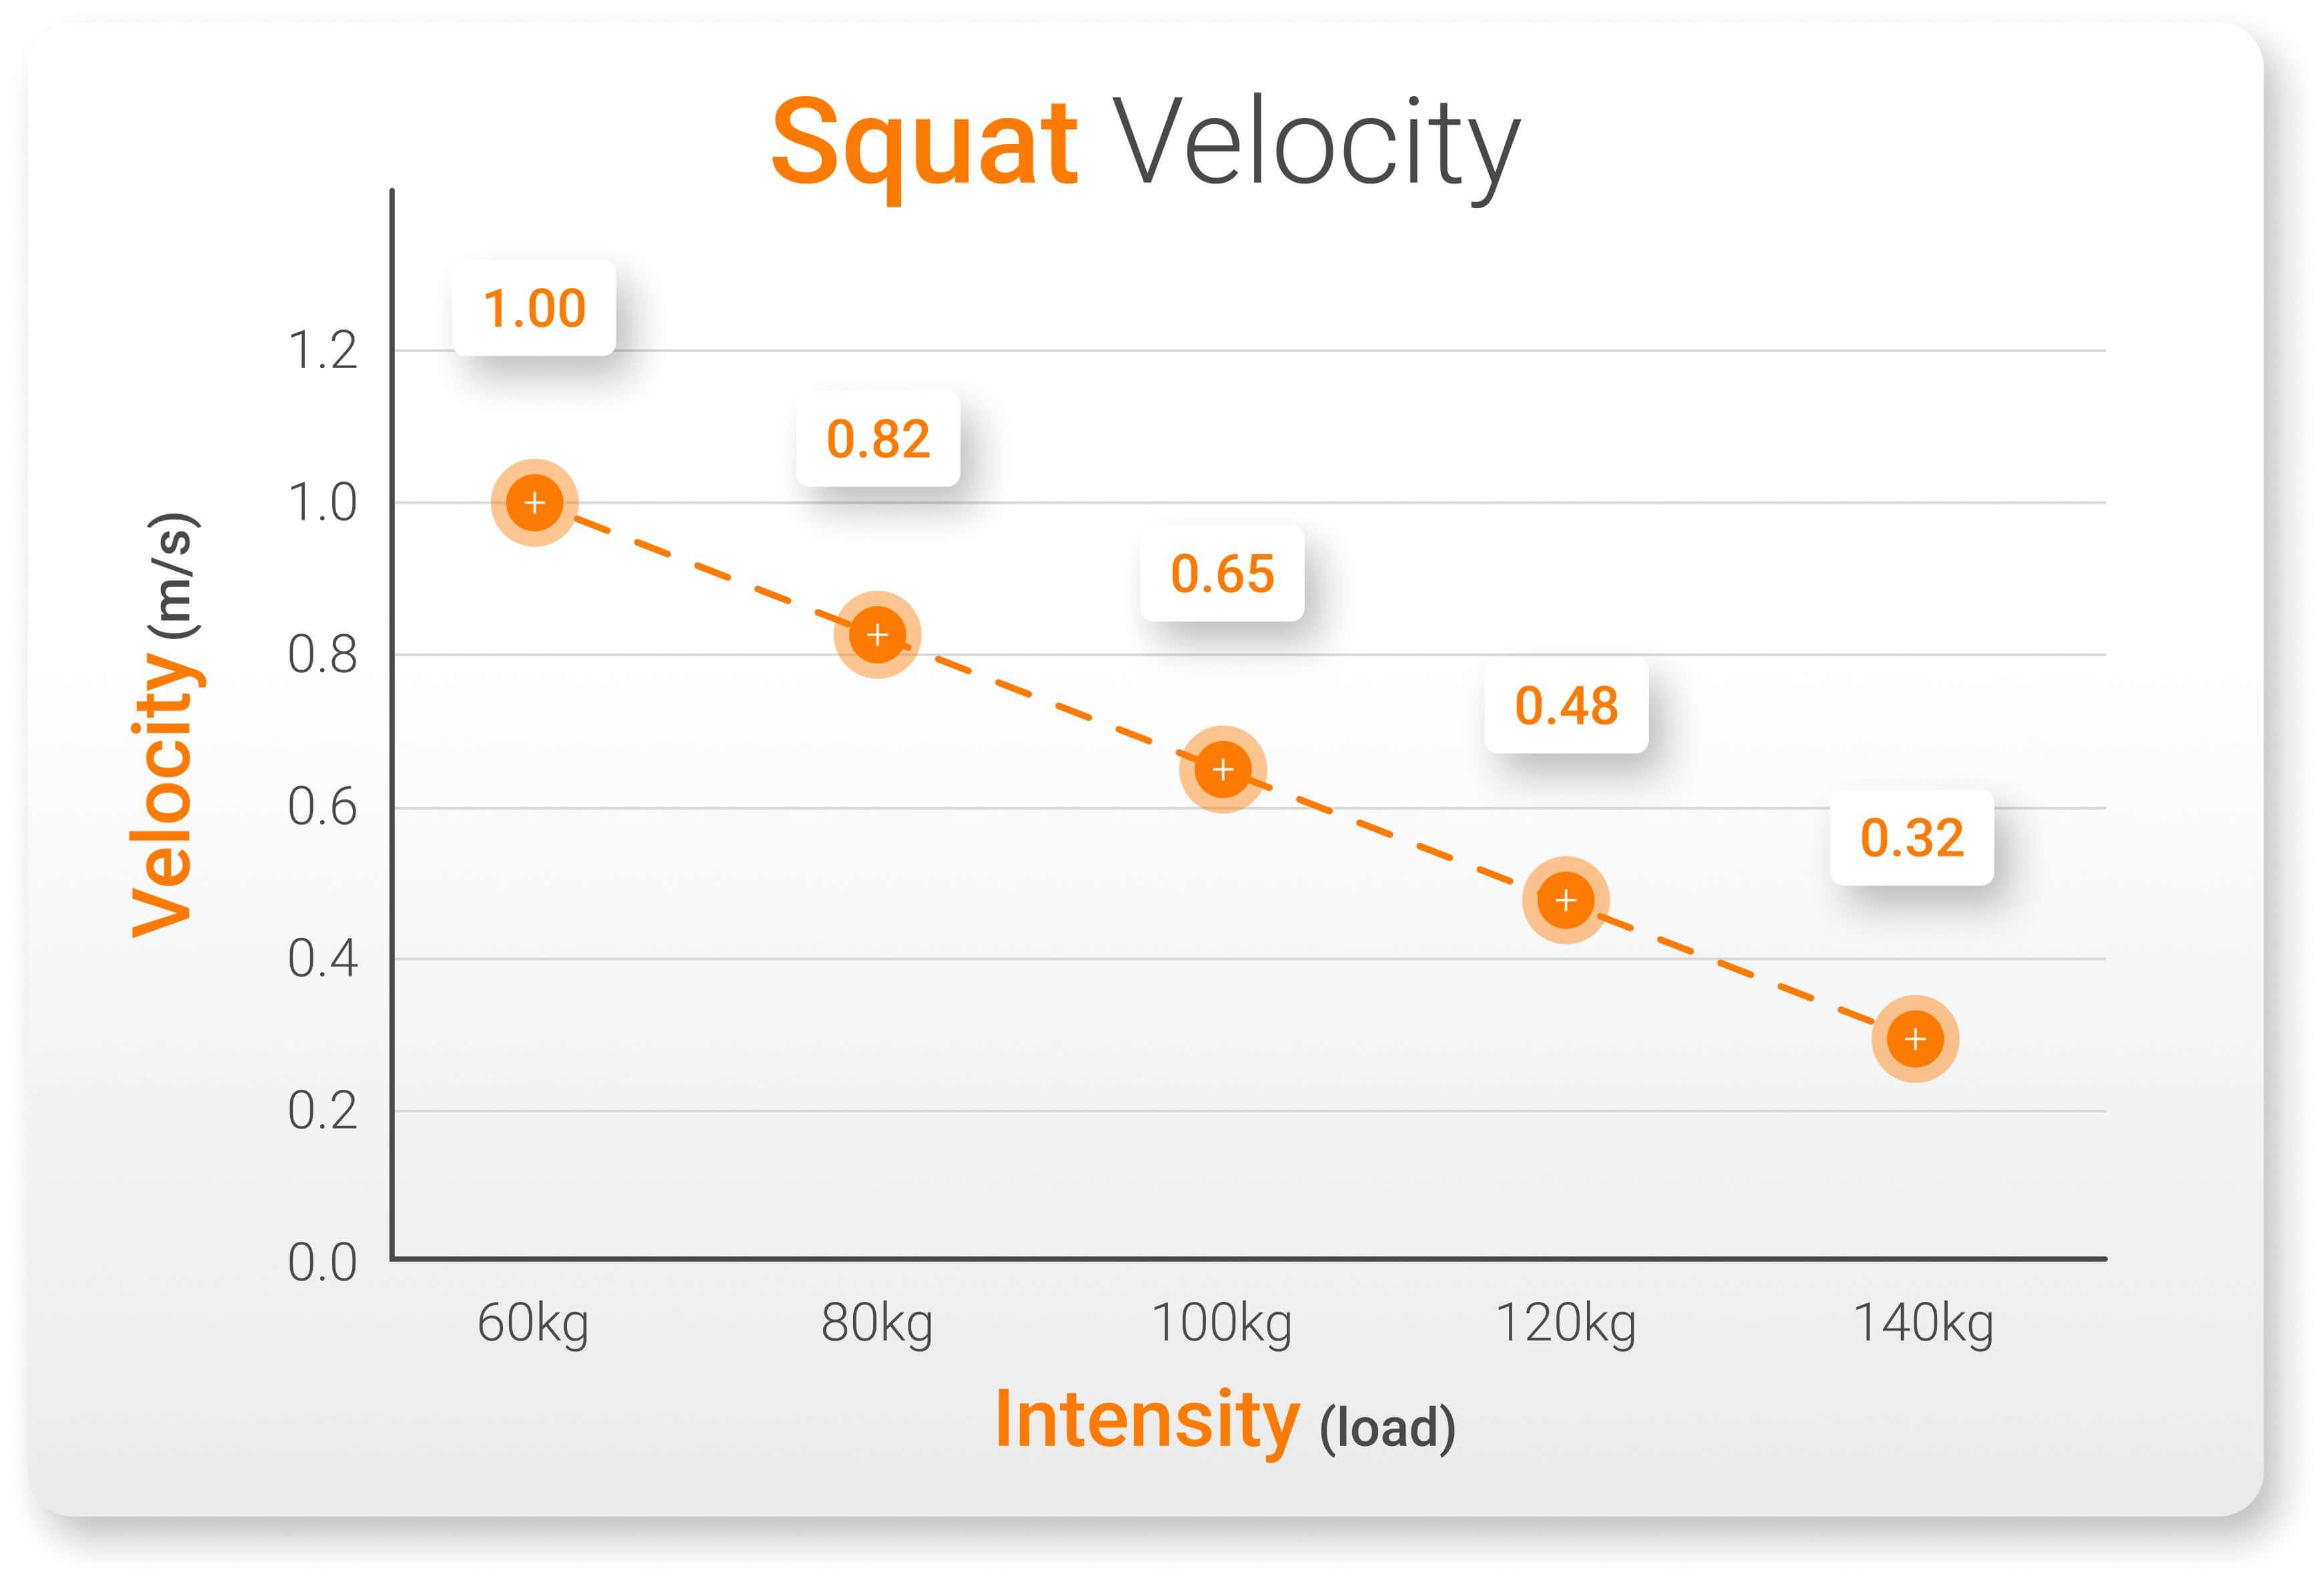
As an athlete performs progressively heavier back squats, their movement velocity can be monitored at each load using a linear position transducer (LPT), such as GymAware:
| Movement | Load | Mean Velocity |
| Back Squat | 60kg (132lb) | 1.00m/s |
| 80kg (176lb) | 0.82m/s | |
| 100kg (220lb) | 0.65m/s | |
| 120kg (264lb) | 0.48m/s | |
| 140kg (308lb) | 0.32m/s |
When load and velocity are plotted together, they typically form a predictable descending relationship. As the external load increases, the athlete’s movement velocity decreases. Together, load and velocity form the essential components of a load-velocity profile, which represents an athlete’s ability to produce movement velocity across a range of external loads.
%1RM: Percentage of one-repetition maximum
Importantly, this relationship assumes the athlete is attempting to perform the concentric phase of each repetition with maximal intent. If an athlete intentionally moves a light load slowly, the measured velocity may no longer provide the same information about their current performance capacity.
Building Individual Load-Velocity Profiles
Collecting velocity across multiple loads allows practitioners to establish an athlete-specific load-velocity profile. This profile provides unique feedback on how well an athlete tolerated each load by reporting their average velocity, rather than simply checking that a set was completed.
Collecting velocity across multiple loads allows practitioners to establish an athlete-specific load-velocity profile …[while] repeated load-velocity profiling can also help identify changes over time.
Repeated load-velocity profiling can also help identify changes over time. When an athlete’s load-velocity relationship is visualized on a graph, there are three theoretical ways they can demonstrate improvement:
- The Graph Moves Up: The athlete moves the same loads at faster average velocities.
- The Graph Moves to the Right: The athlete moves greater loads at the same velocities.
- The Graph Moves Up and to the Right: The athlete moves greater loads at greater velocities.
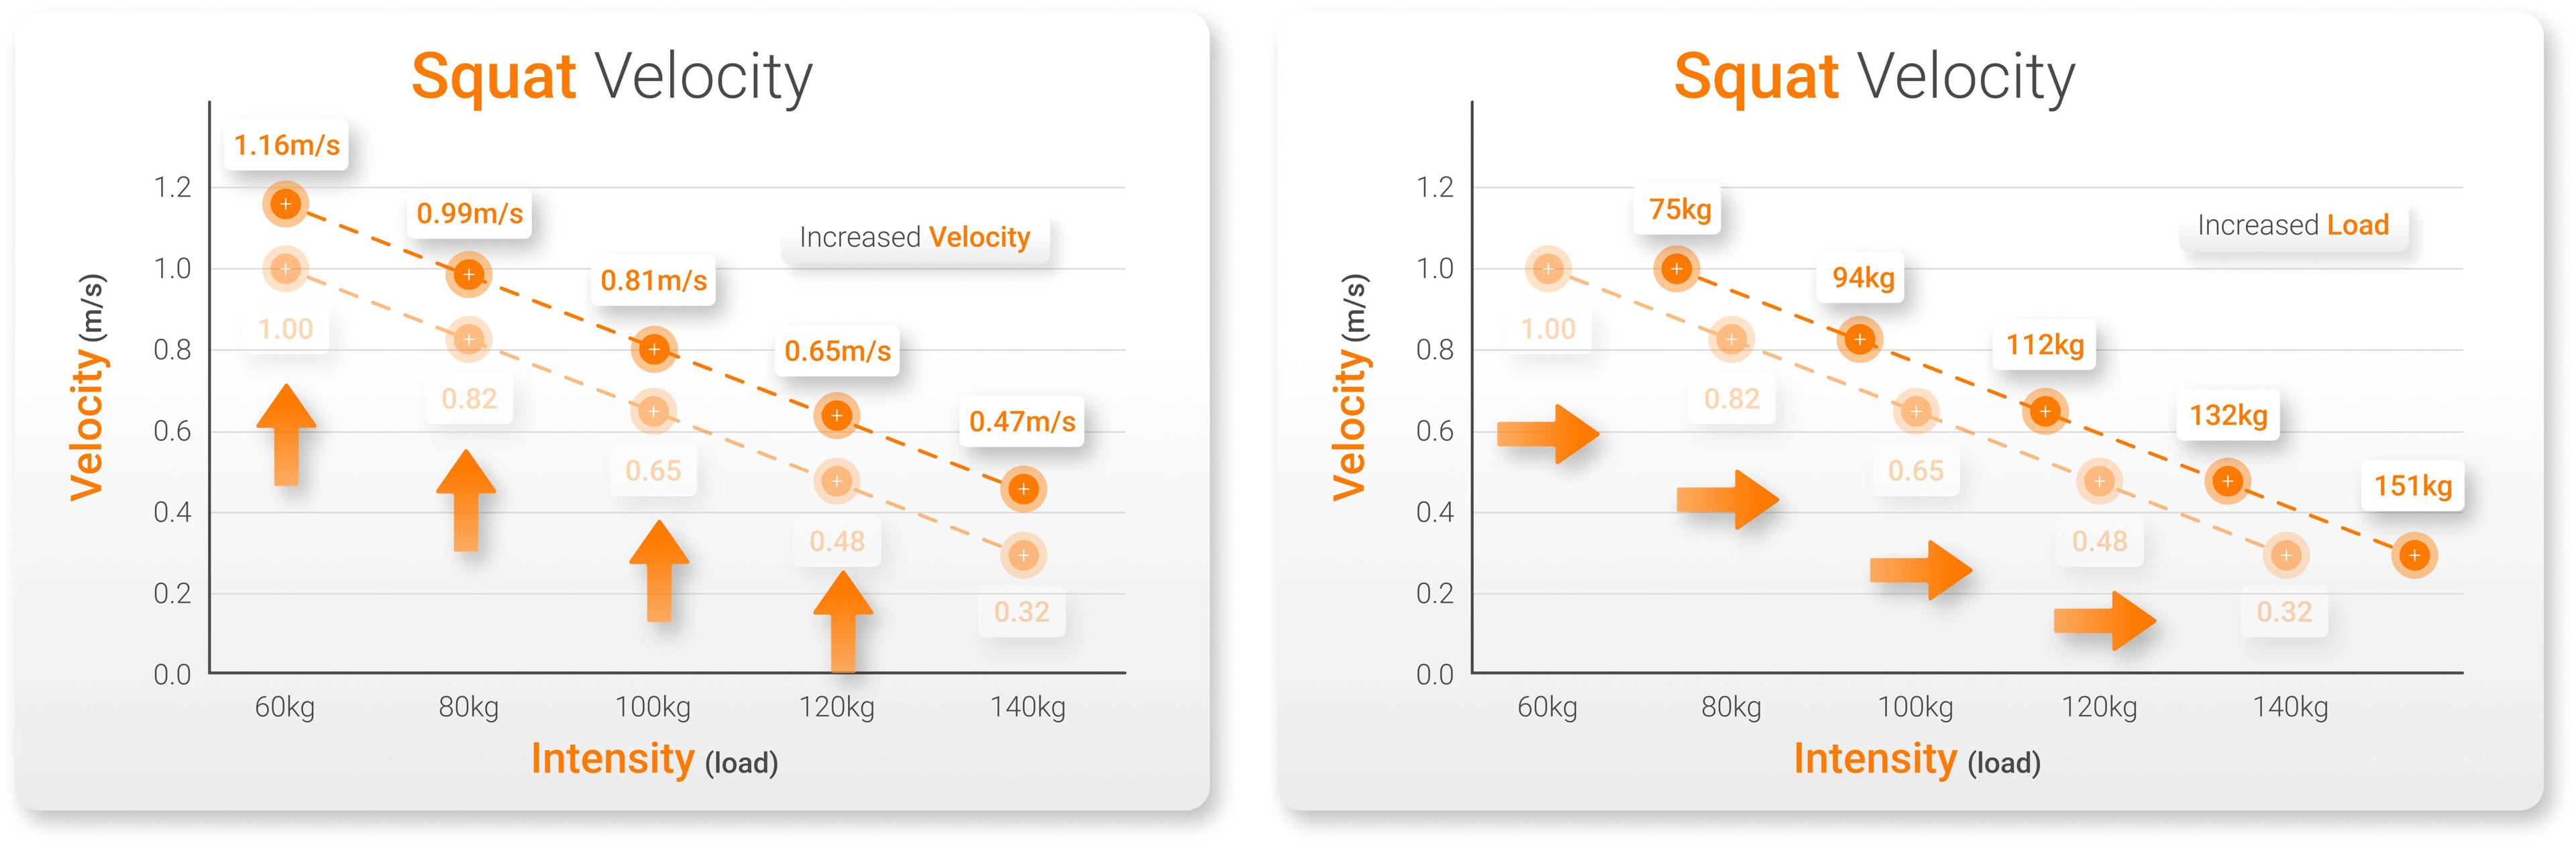
These progressions, however, are mostly theoretical. When an athlete demonstrates an improvement in their load-velocity profile, whether mostly vertical or horizontal, the shift in the graph reflects improvements in both strength and velocity, because changes in one part of the load-velocity relationship influence the profile as a whole.
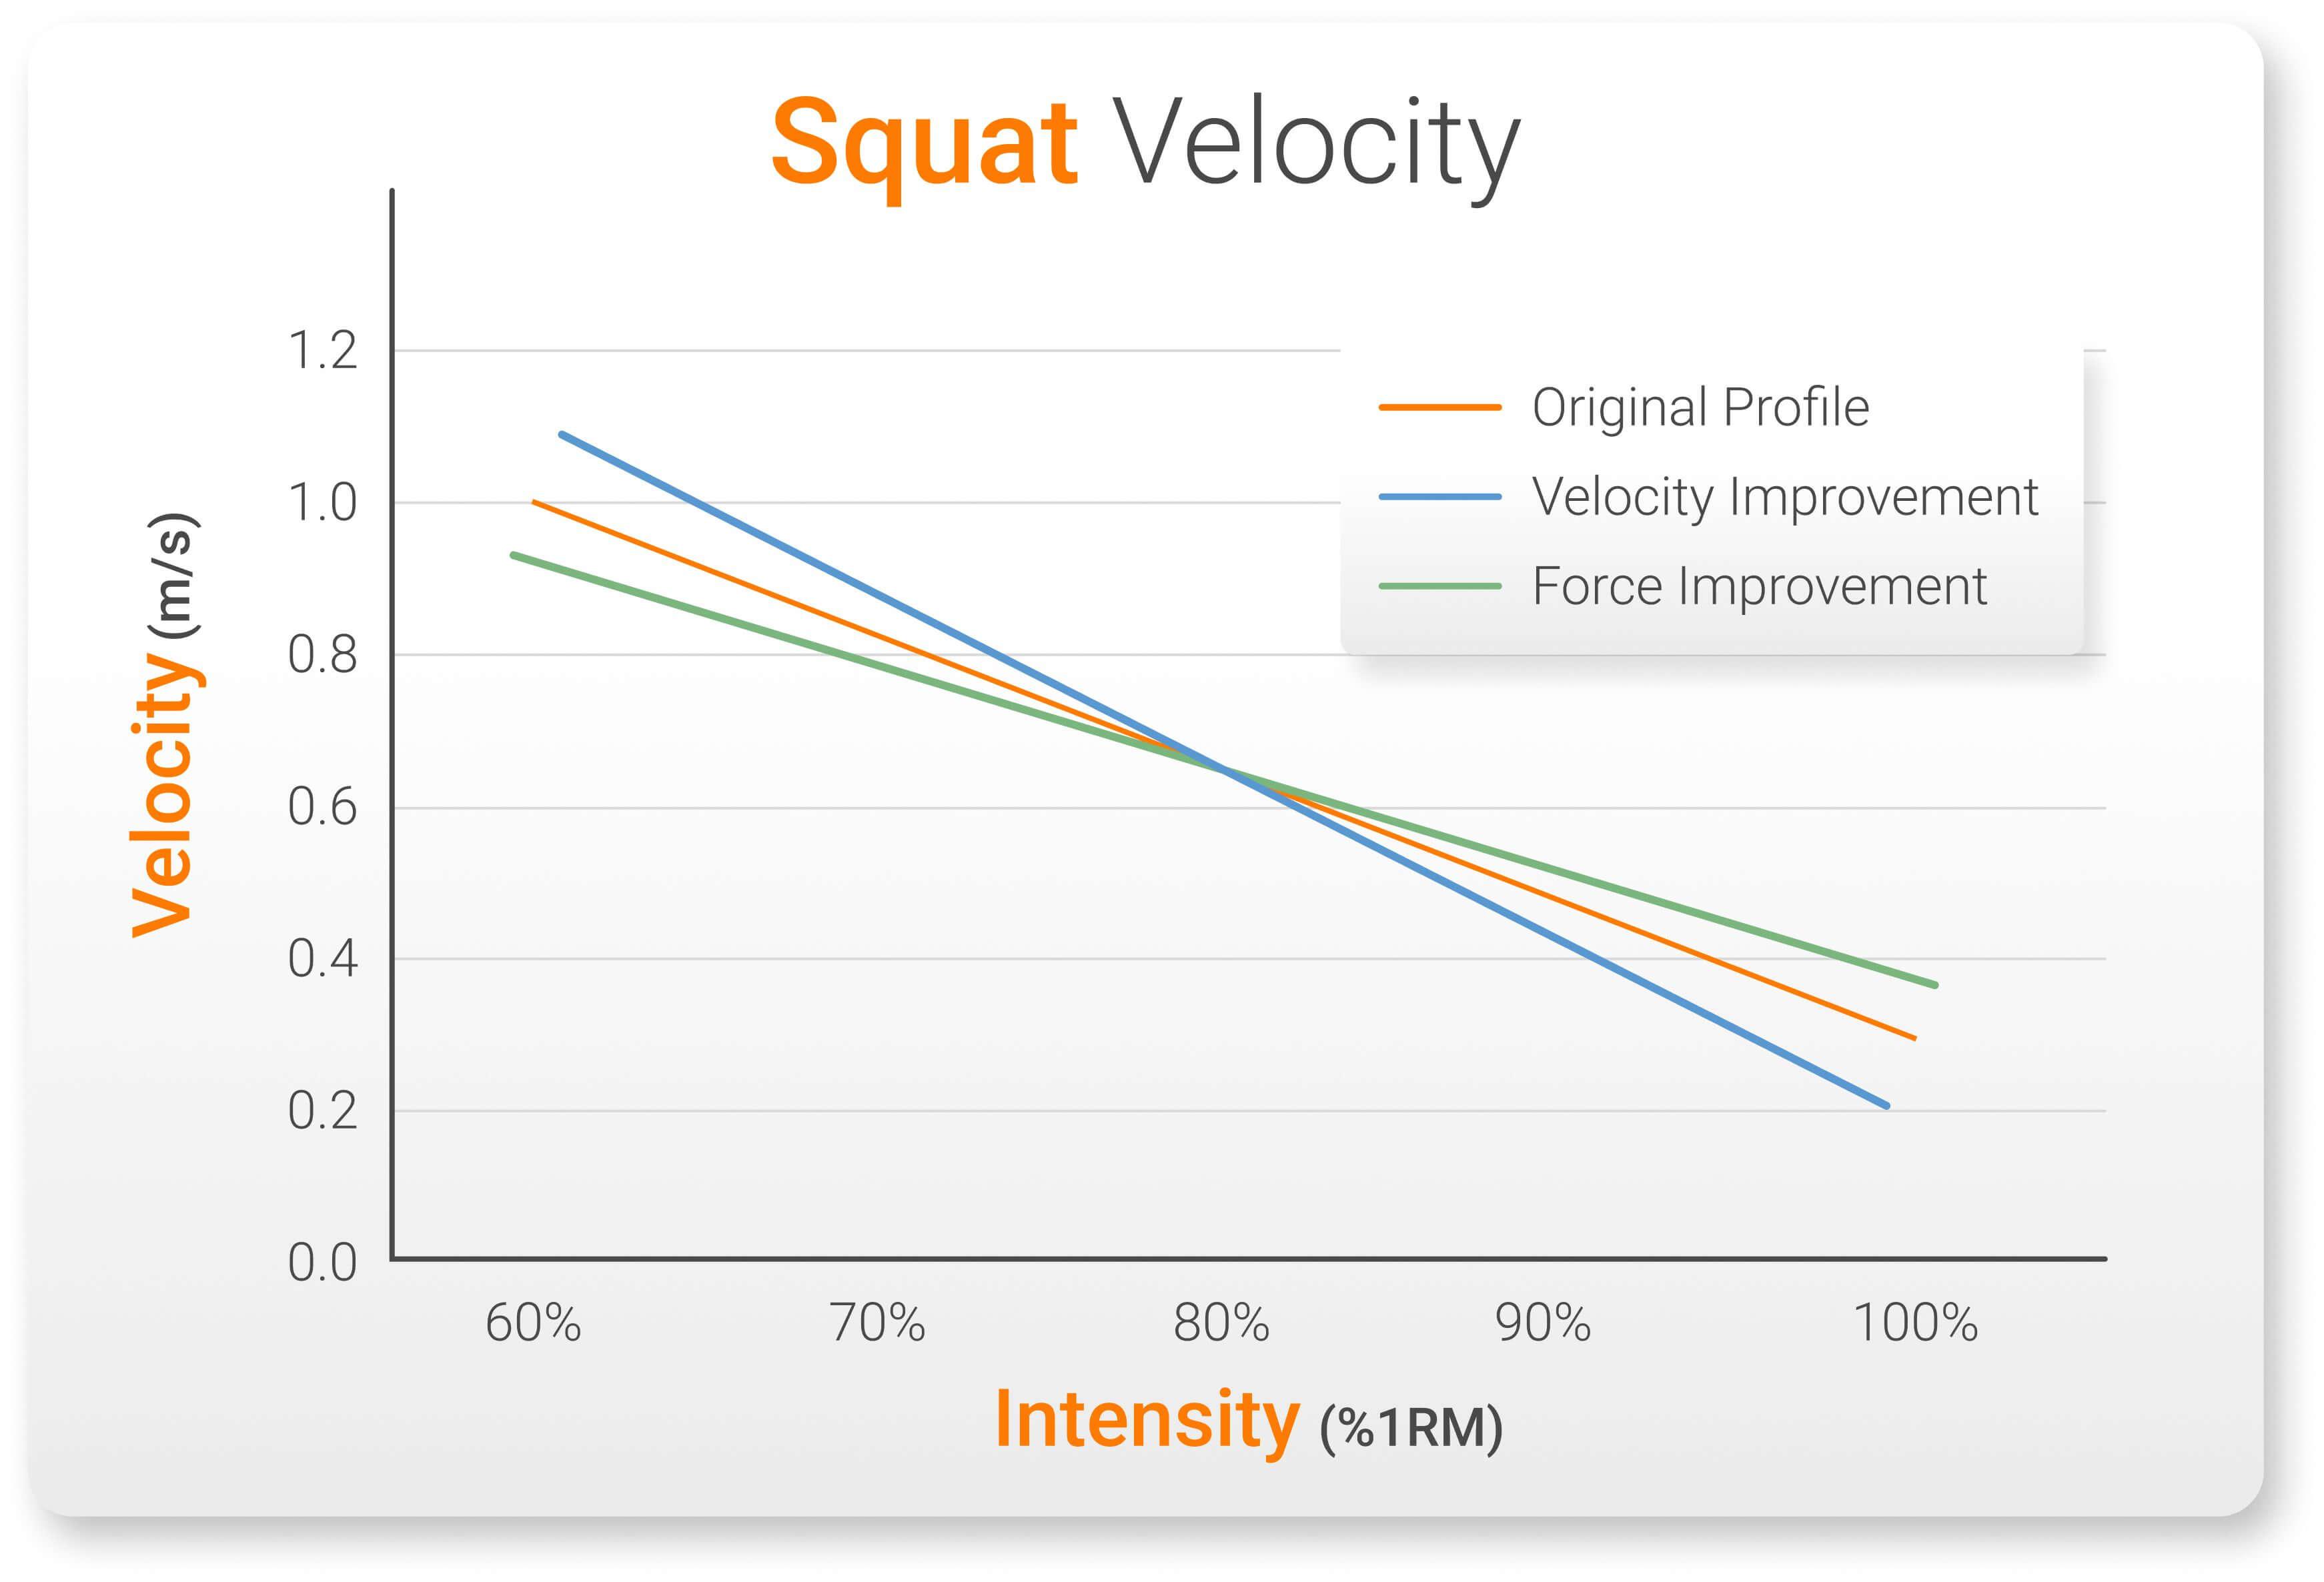
Nevertheless, there are instances where progression may occur without a shift in the load-velocity graph. Some practitioners may opt to plot velocity against relative load, often expressed as an athlete’s %1RM. In this scenario, changes or progressions in a load-velocity graph may be reflected in the slope of the profile rather than only as a shift in the line’s position on the graph.
For example, if an athlete has just completed an accelerative- or maximal-strength phase in their programming, there may be a reduction in the graph’s slope, indicating progression at heavier loads. Similarly, if an athlete has been focusing on speed-strength and starting-strength zones, retesting their load-velocity profile may show an increase in the graph’s slope, demonstrating higher velocities at lower %1RM values.
However, changes should always be interpreted within the context of measurement reliability, normal variability and the athlete’s training environment.
…changes should always be interpreted within the context of measurement reliability, normal variability and the athlete’s training environment.
Not All Profiles Are the Same
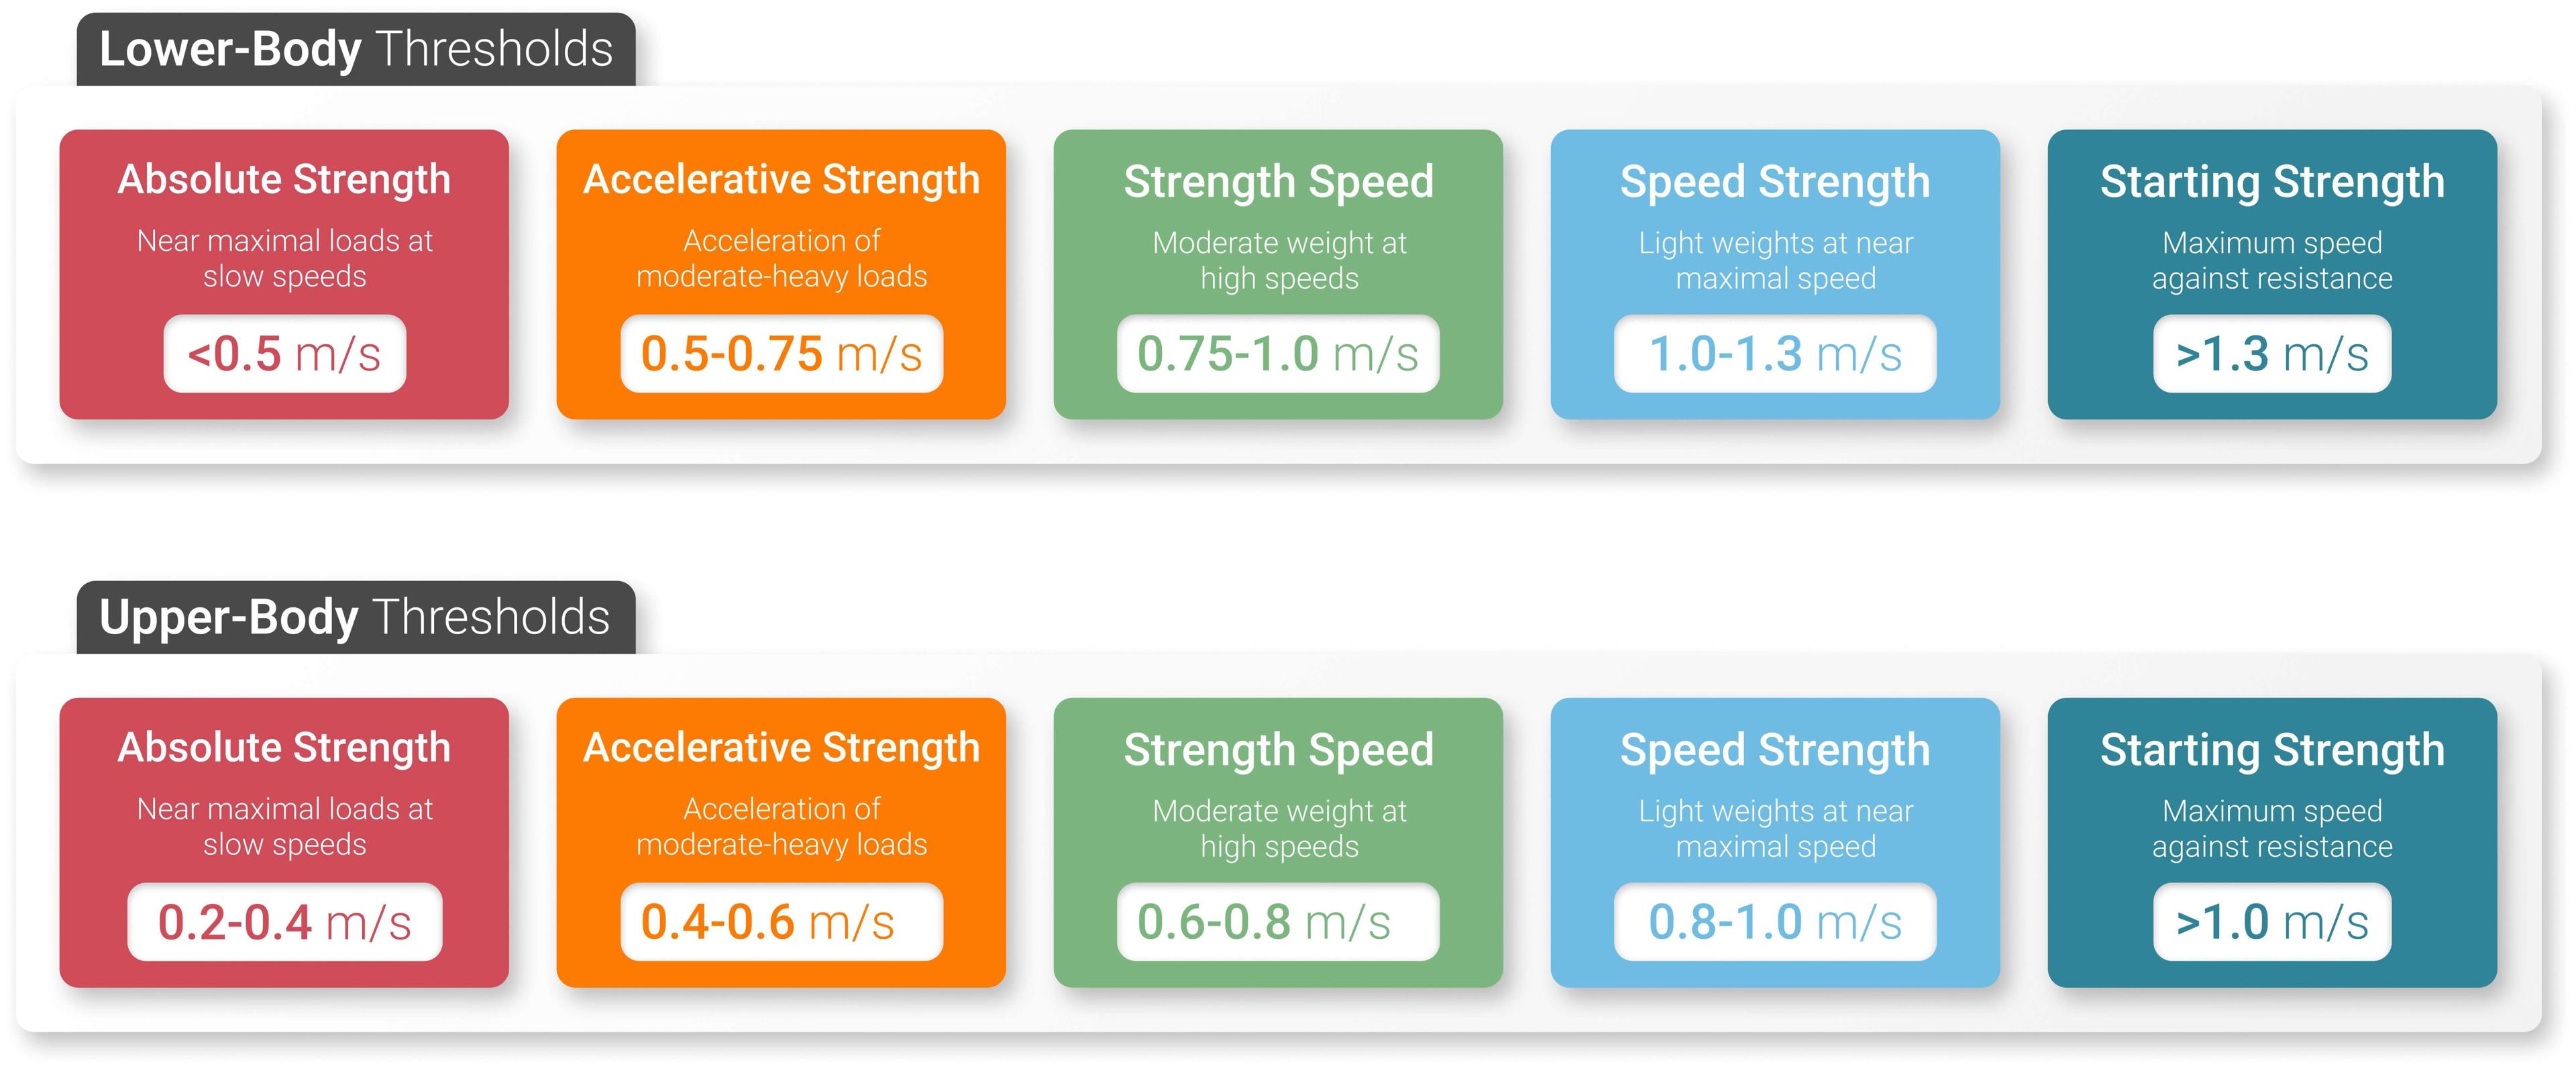
Exercise selection matters considerably when performing a load-velocity profile. A given velocity does not necessarily represent the same relative intensity across different exercises. For example, a squat performed at 0.50m/s should not automatically be interpreted in the same way as a bench press executed at 0.50m/s.
Mechanical characteristics, range of motion, technique and individual differences can all influence the load-velocity relationship. The following visualizations provide practical starting points for practitioners introducing VBT into upper- and lower-body resistance training.
Estimating 1RM Using Velocity
One application of the load-velocity relationship is estimating maximal strength without requiring athletes to perform maximal lifts regularly.
Maximal-strength testing and one-repetition maximum (1RM) assessments can be time-consuming and fatiguing for athletes, limiting performance for multiple days after training. This often makes 1RM assessments impractical for many athletes and practitioners working in sport. However, load-velocity profiles can be used to estimate 1RM by extrapolating the relationship between submaximal loads and movement velocity toward the velocity associated with maximal loading.
…load-velocity profiles can be used to estimate 1RM by extrapolating the relationship between submaximal loads and movement velocity toward the velocity associated with maximal loading.
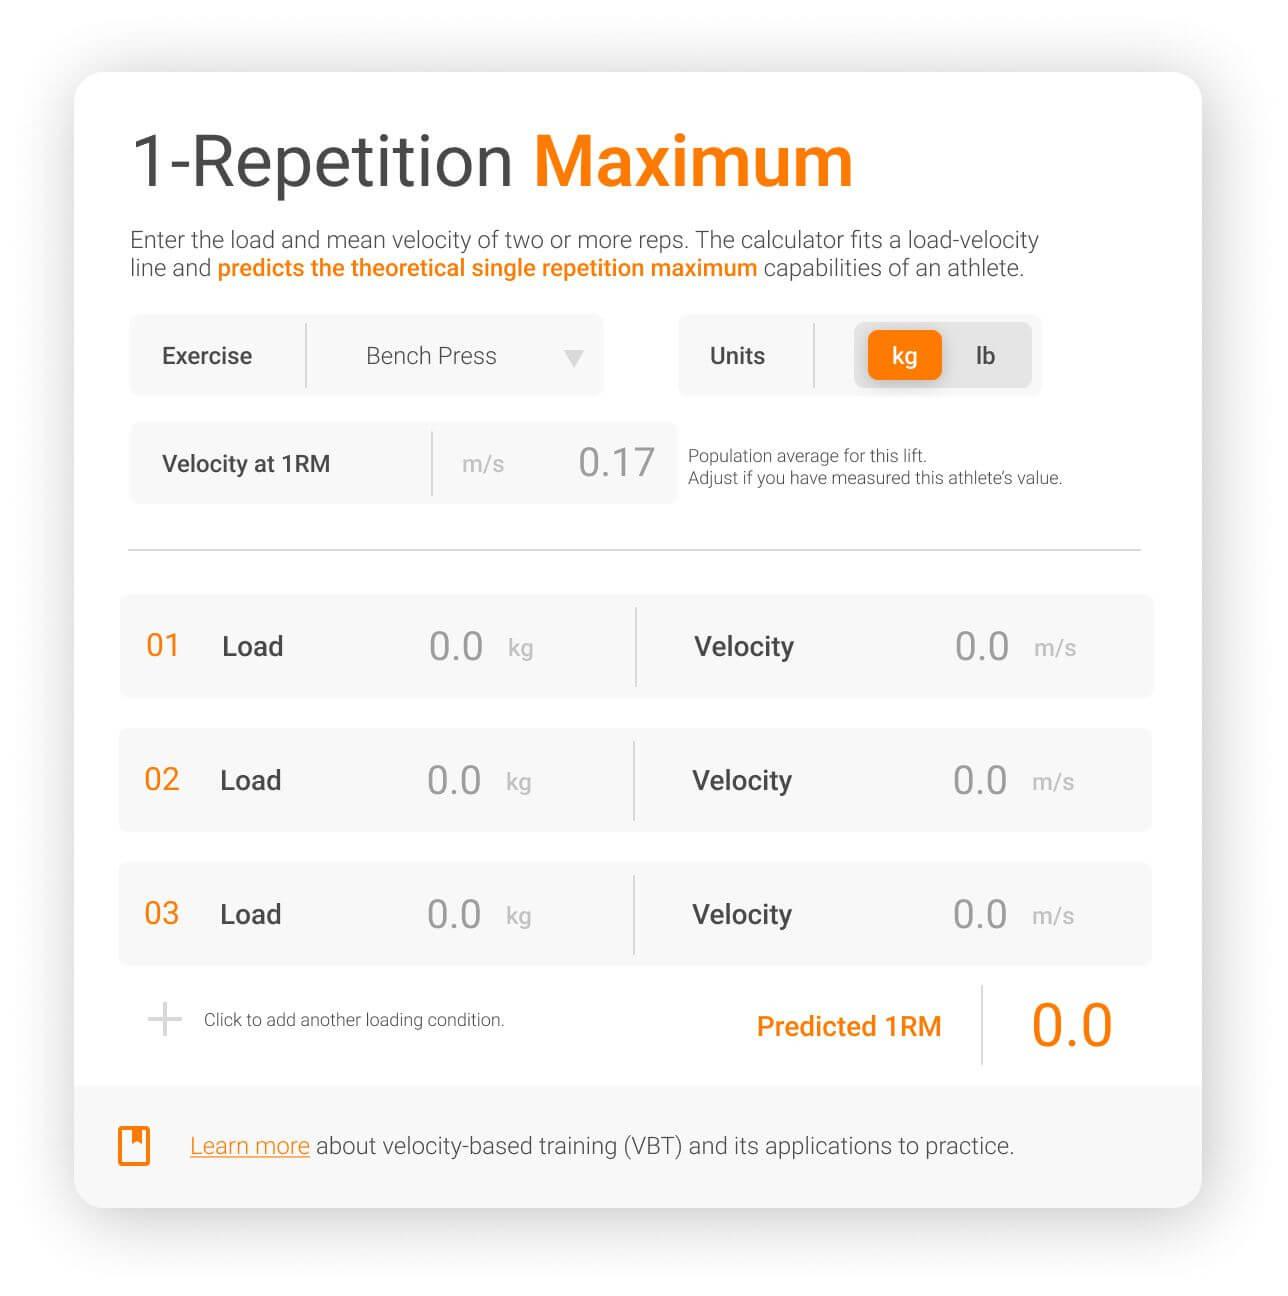
For visual purposes only. See VALD’s Calculators page for all interactive calculators.
Rather than separating training and testing into entirely different sessions, simply attaching an LPT cable to a bar can allow practitioners to collect useful performance information during resistance training that athletes are already completing.
Individual Profiles Versus Generalized Thresholds
Population-level velocity thresholds can provide useful reference points, but individual load-velocity relationships may offer greater context. Two athletes with the same 1RM do not necessarily move every submaximal load at the same velocity. Differences in anthropometrics, technique, training history and the ability to complete slow repetitions can influence their profiles.
Population-level velocity thresholds can provide useful reference points, but individual load-velocity relationships may offer greater context.
Where sufficient data are available, practitioners can use individual profiles to understand what is typical for a specific athlete and exercise rather than relying exclusively on generalized thresholds.
An estimated 1RM should also be interpreted as an approximation rather than an exact representation of maximal capacity. Day-to-day variability and technical differences between repetitions can all influence VBT results.
Applying Load-Velocity Profiles in Practice
Load-velocity profiling underpins several practical VBT applications, including estimating 1RM, prescribing training intensity, monitoring performance and identifying changes in strength qualities over time.
Estimated 1RM can provide a useful representation of maximal strength, while changes across the broader profile can offer additional context. For example, an athlete’s estimated 1RM may remain relatively stable while their ability to move moderate loads at higher velocities improves – an adaptation that may be particularly relevant depending on the athlete and training objective.
Ultimately, the value of VBT extends beyond any single metric. By collecting velocity consistently and interpreting changes within the context of the athlete, exercise and training phase, practitioners can use load-velocity profiles to support more informed resistance training prescription and monitoring.
To learn more about how GymAware can support velocity-based training, load-velocity profiling and 1RM estimation in your practice, get in touch with our team.
