Recalibrating DSI with the Isometric Belt Squat
The isometric belt squat (Iso Belt Squat) has become an increasingly popular method for objectively assessing maximal lower-body strength. As adoption grows, so does the need to better understand how its outputs should be interpreted, particularly when used to inform compound metrics such as the dynamic strength index (DSI), where differences in force characteristics compared to assessments such as the isometric mid-thigh pull (IMTP) may influence how values are contextualized.
This article examines how the Iso Belt Squat influences DSI interpretation and why DSI thresholds derived from IMTP data should not be directly applied without recalibration.
Before continuing, we recommend reading the first Isometric Belt Squat article if you are unfamiliar with its setup, execution and data quality considerations.

Basic Application of the Iso Belt Squat
The primary application of the Iso Belt Squat is the assessment of maximal lower-body strength. However, its peak force output can also be combined with a dynamic assessment, most commonly the countermovement jump (CMJ), to calculate DSI.

Pairing CMJ peak force with Iso Belt Squat peak force provides a practical framework for interpreting dynamic force expression relative to maximal force capacity. The Iso Belt Squat contextualizes performance at the individual level by setting a maximum force ceiling, providing a simple comparison value for performance on other isometric or dynamic assessments.
The Iso Belt Squat contextualizes performance…by setting a maximum force ceiling…[comparing] performance on other isometric or dynamic assessments.
For example, a CMJ peak force of 2,488 newtons (N) alone is not particularly helpful. However, understanding an athlete’s DSI of 0.38 (Iso Belt Squat peak force of 6,521N) allows practitioners to better compare CMJ performance relative to the athlete’s maximal force-generating capacity.
Unlike maximal isometric assessments, CMJ peak force is influenced by movement velocity, coordination and technical execution. As a result, it reflects an athlete’s dynamic force expression rather than their maximal force-producing capacity alone.
This relationship is typically only moderate, meaning athletes with similar maximal strength levels can still demonstrate substantially different dynamic force outputs.
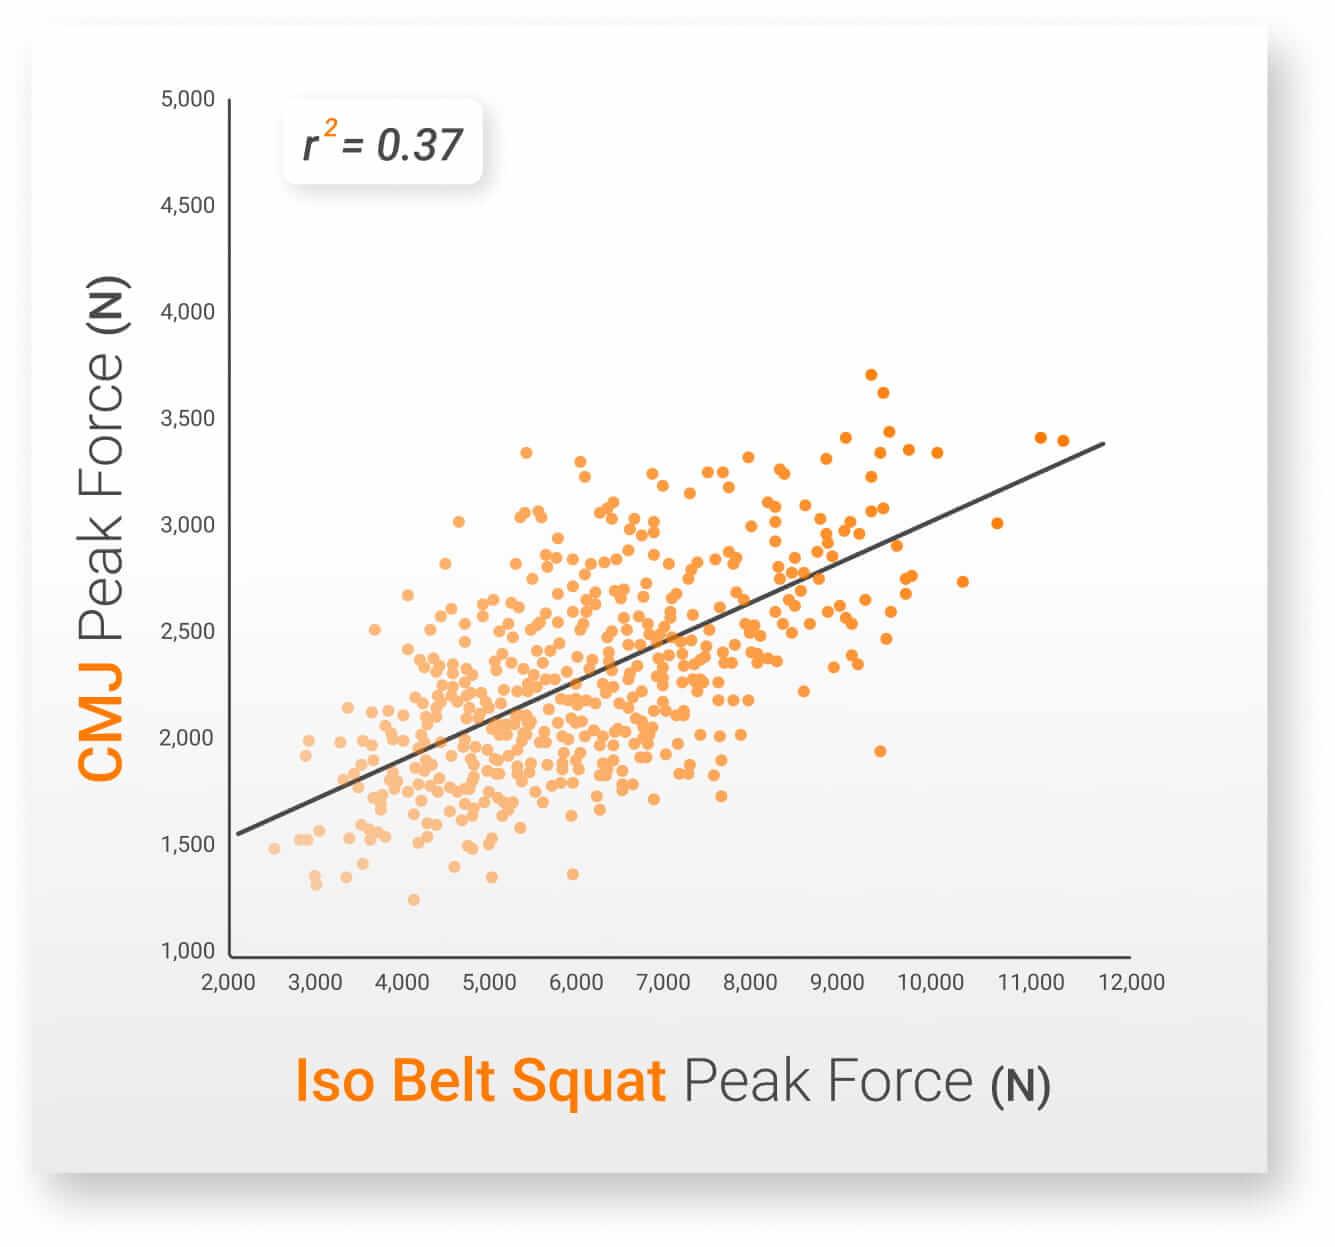
The moderate relationship (r2 = 0.37) between Iso Belt Squat and CMJ peak force.
Strength Profiling with the Iso Belt Squat
Strength is task-specific. The force an athlete can produce and how effectively they express it change based on the constraints of the assessment being performed. This has shaped strength profiling approaches for decades, reinforcing the need to assess force production across multiple testing conditions rather than relying on a single test in isolation (Young, 1995; Zatsiorsky, 1995).
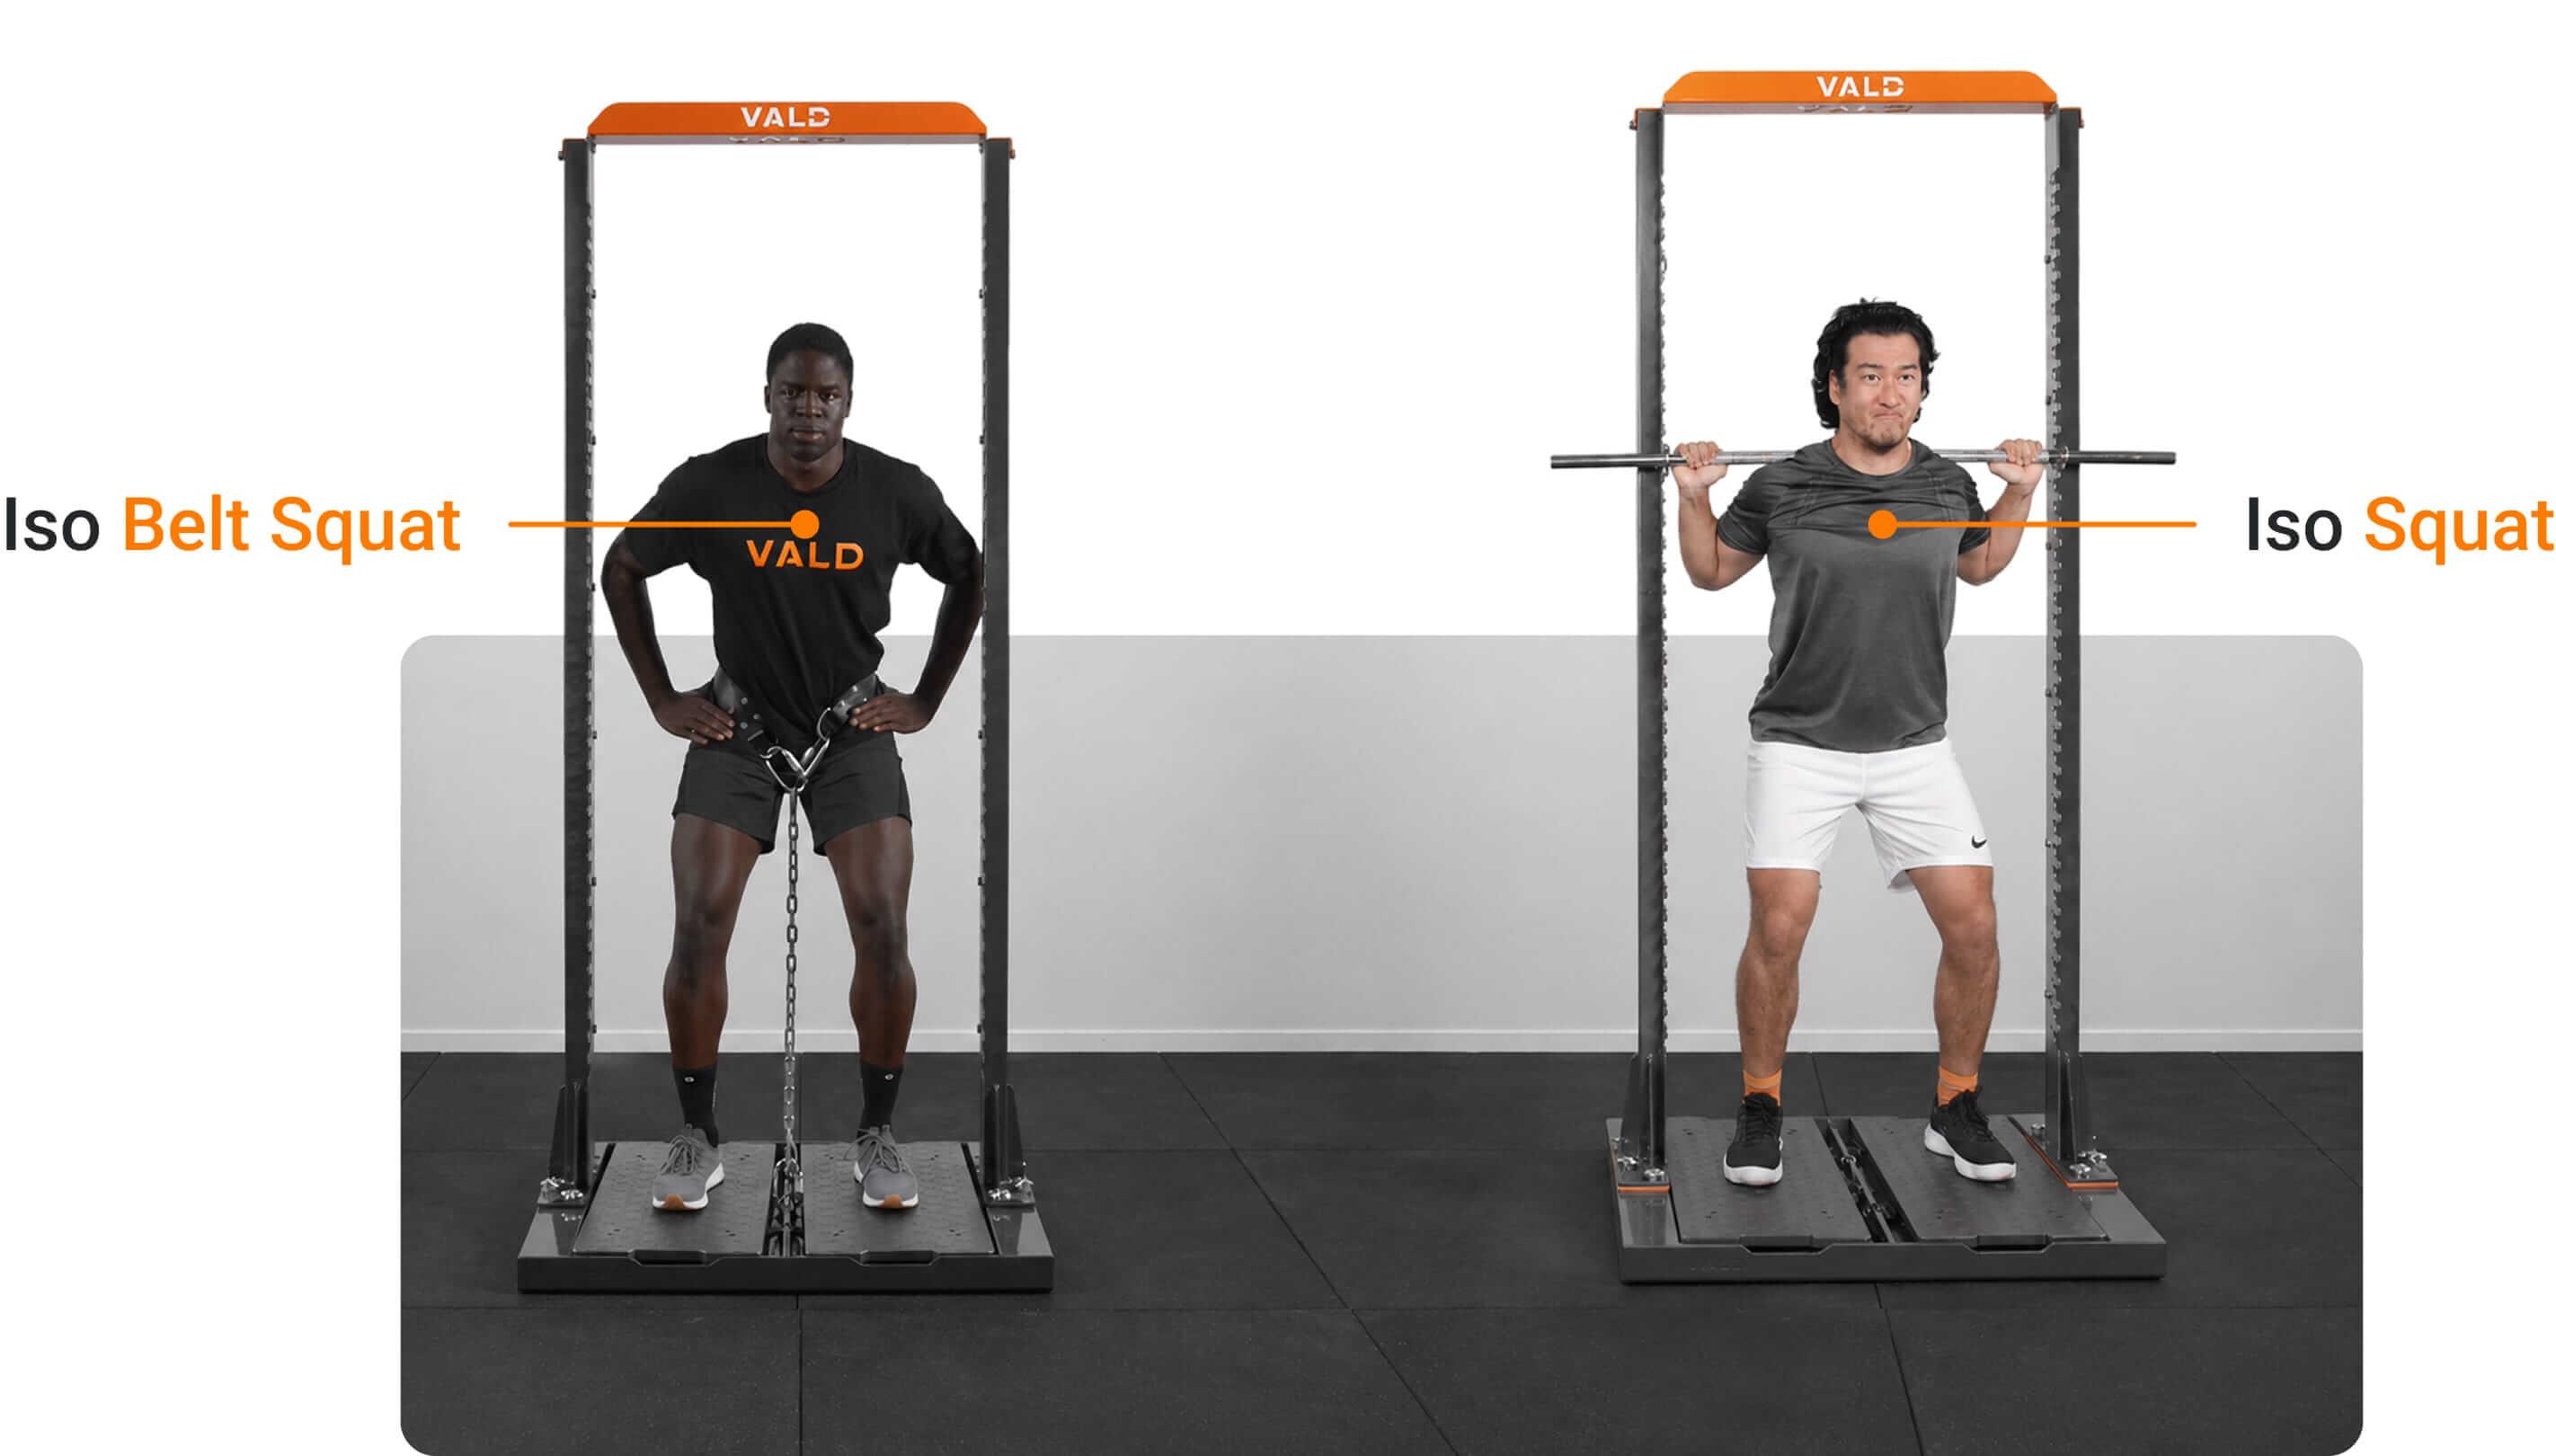
One early example was the maximum dynamic strength index (MDSI), which compared CMJ peak force with isometric squat (Iso Squat) peak force to assess how effectively maximal force capacity transferred to dynamic movement (Young, 1995). Although the Iso Squat and Iso Belt Squat have similar names and assess the same quality using similar positions, they differ in their setup:
- Iso Belt Squat: Force is applied through a belt positioned around the hips.
- Iso Squat: Force is applied through a fixed bar positioned across the upper trapezius.
Over time, practitioners shifted from the Iso Squat to the IMTP, leading to the development of the DSI and revised thresholds to guide training emphasis (Sheppard et al., 2011).
Over time, practitioners shifted from the Iso Squat to the IMTP, leading to the development of the DSI and revised thresholds to guide training emphasis.
| DSI Score | Training Recommendation |
| < 0.60 | Ballistic strength training |
| 0.60-0.80 | Concurrent strength training |
| > 0.80 | Maximal strength training |
Training recommendations based on IMTP- and SJ-derived DSI scores. Adapted from Sheppard et al. (2011).
Why the Iso Belt Squat Changes the Equation
The shift from the Iso Squat to the IMTP addressed practical limitations related to bar placement and shoulder discomfort, but introduced additional task constraints. While the IMTP is a robust assessment, force output can also be influenced by upper-body strength, grip and technical proficiency, rather than lower-body force production alone.
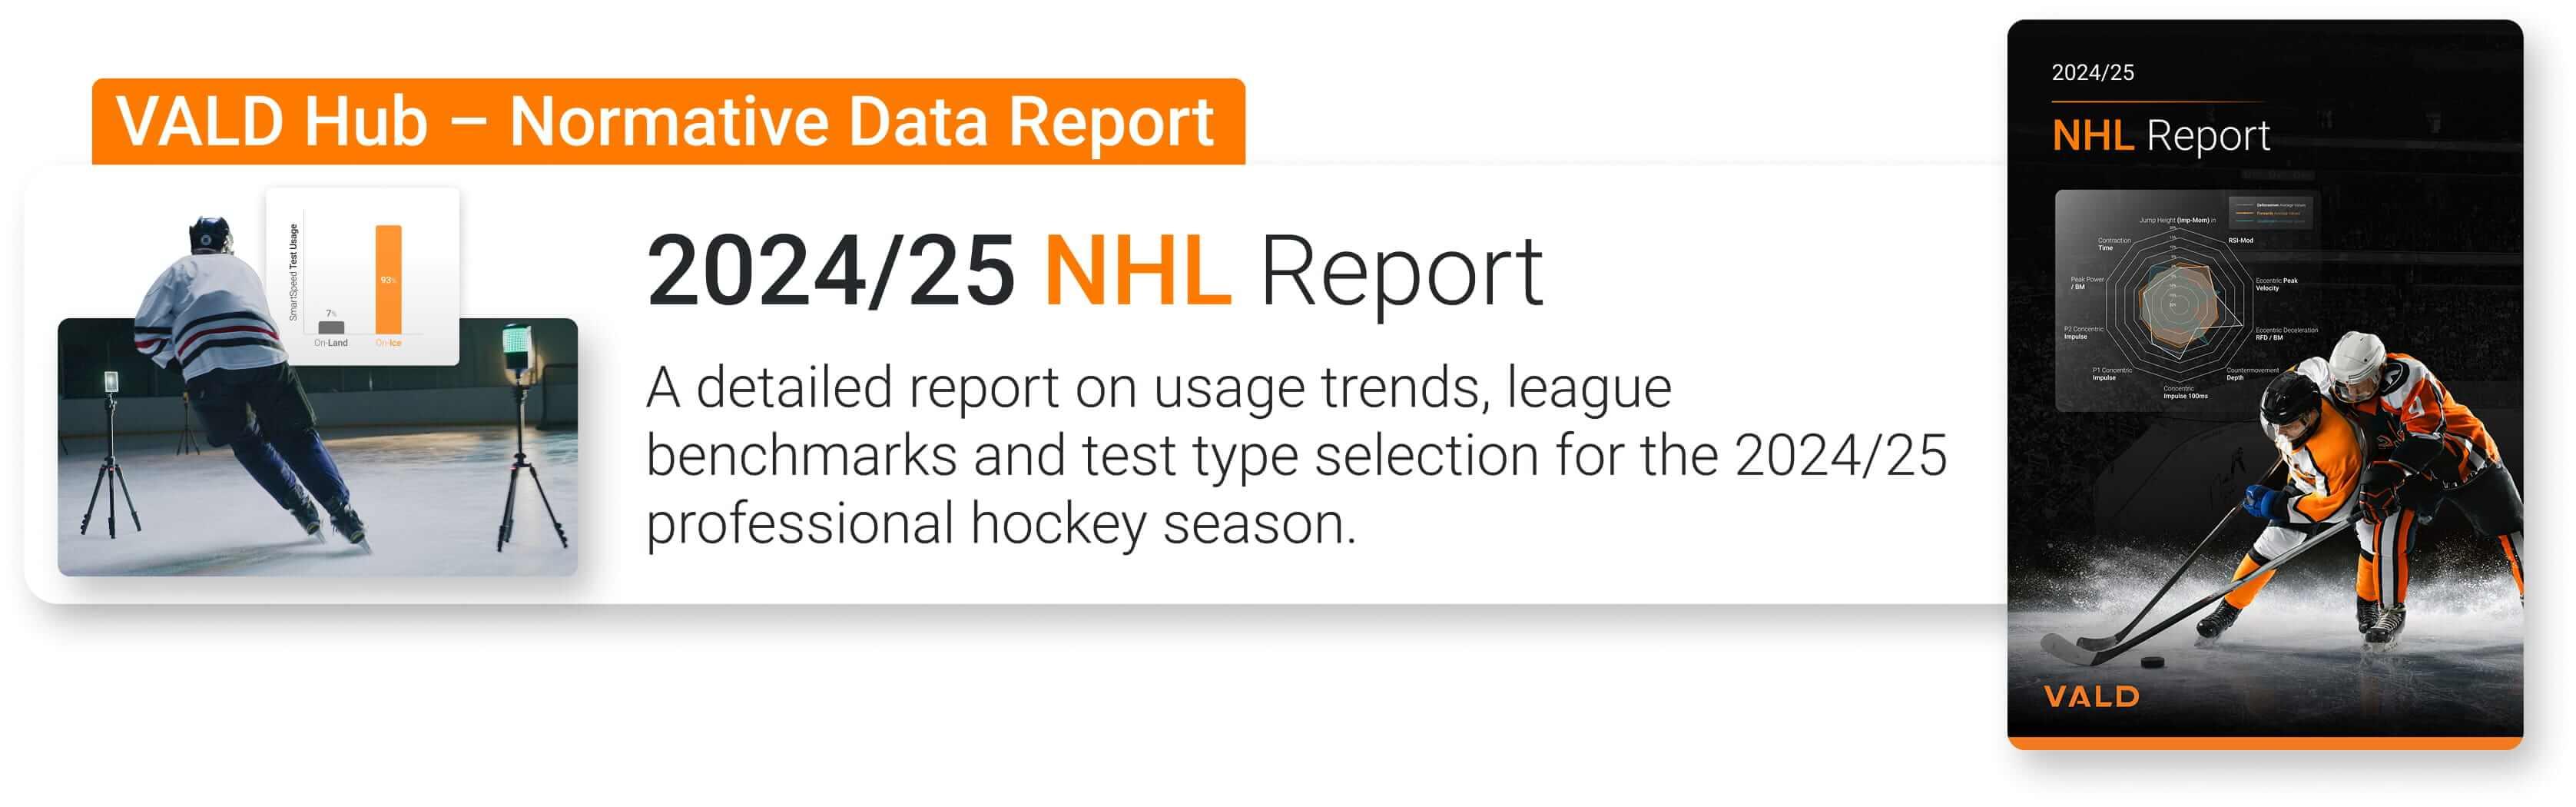
The Iso Belt Squat eliminates many of the constraints of both tests by relocating the force application to a padded hip belt, alleviating spinal compression and shoulder discomfort, while also removing upper-body limitations such as grip strength. In fact, data from the 2024/25 NHL Report showed that Iso Belt Squat peak force values could exceed IMTP peak force values by more than 50%.
As a result, DSI values derived from the Iso Belt Squat should not be expected to align directly with DSI values established from the IMTP, as the reference force values are generated under different task constraints.
…DSI values derived from the Iso Belt Squat should not be expected to align directly with DSI values established from the IMTP…
Recalibrating DSI for the Iso Belt Squat
Because the Iso Belt Squat typically produces higher peak force values than the IMTP, applying IMTP-derived DSI thresholds directly to Iso Belt Squat data will often classify athletes as force dominant. When the same CMJ data is used, the higher isometric force output lowers the DSI ratio, reinforcing the need for assessment-specific thresholds.
Using a combined Iso Belt Squat and CMJ dataset (n = 541) across multiple sports and competition levels, the distribution of DSI values was explored. The median DSI was 0.39, while the interquartile range (IQR; 0.33-0.46) represented a more balanced athlete profile. Values below the 25th percentile (less than 0.33) reflected greater force dominance, whereas values above the 75th percentile (greater than 0.46) indicated greater velocity dominance.
Values below the 25th percentile reflected greater force dominance, whereas values above the 75th percentile indicated greater velocity dominance.
These values are best interpreted as directional guides rather than strict cutoffs and should always be considered within the context of the assessments performed.
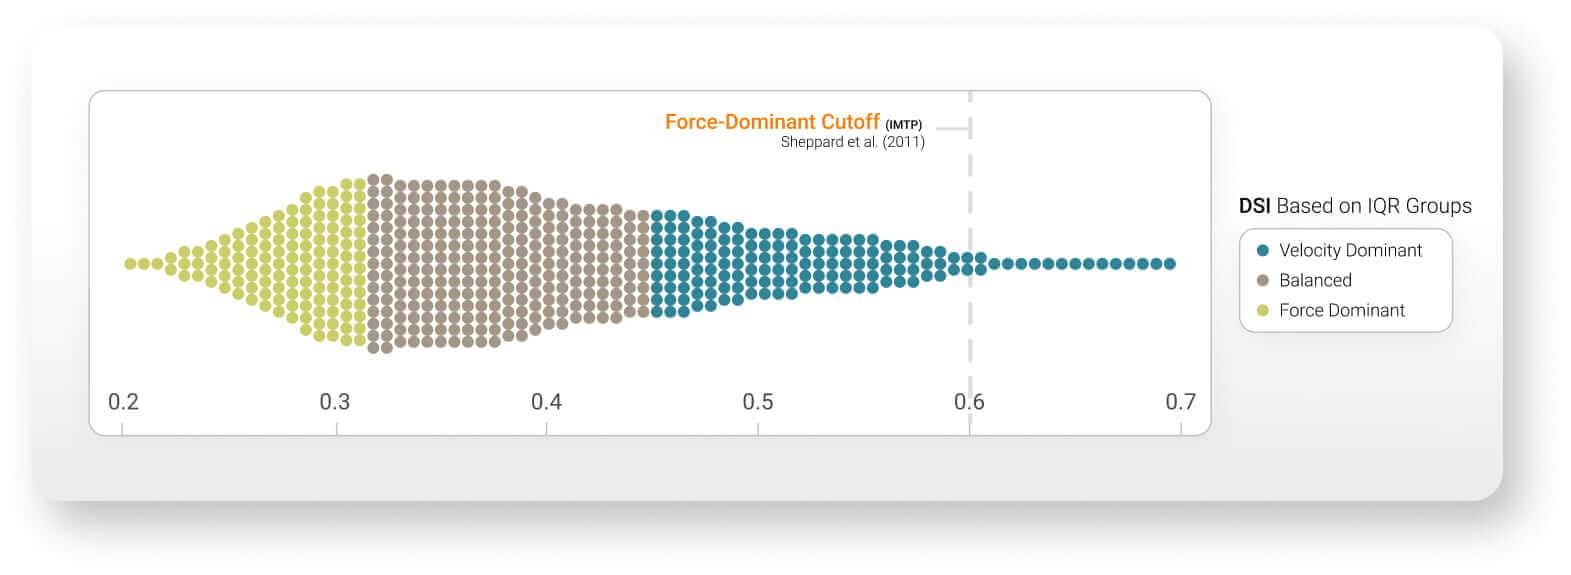
DSI distribution of the sample dataset. IQR-based thresholds were used because applying Sheppard et al. (2011) IMTP-based thresholds classified 98% of athletes as “force dominant.”
Interpreting DSI
DSI profiles should not be interpreted as inherently “good” or “bad.” Instead, they provide a framework for understanding how an athlete expresses dynamic force at high velocity relative to their maximal force capacity. This gives the DSI practical value beyond absolute outputs alone.
Athletes may demonstrate similar maximal force-generating capacity in the Iso Belt Squat yet differ substantially in their expression of peak force during jumping. DSI assessments, therefore, can help answer two primary questions in performance assessment and support more effective decision-making for practitioners:
- How strong is this athlete?
- How effectively can this athlete express their strength dynamically?
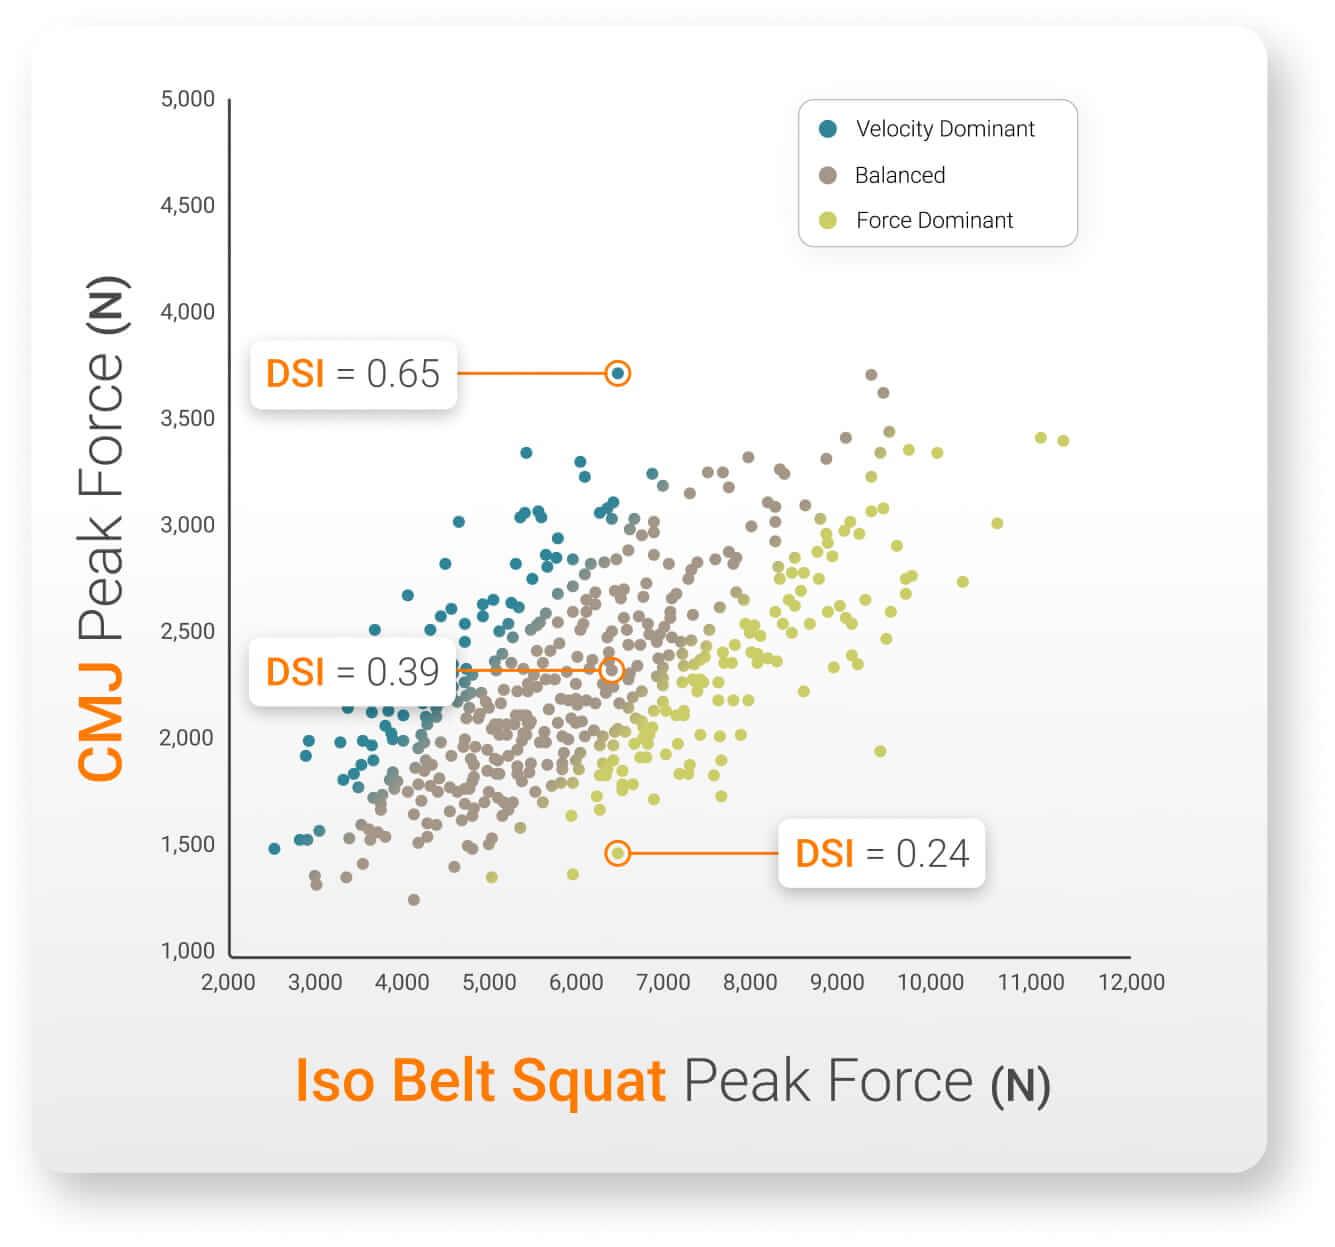
Relationship between Iso Belt Squat and CMJ peak force. Colors represent the three DSI groups using the recalibrated thresholds.
Athletes may demonstrate similar maximal force-generating capacity in the Iso Belt Squat yet differ substantially in their expression of peak force during jumping.
When DSI distributions are examined at a cohort level, clear trends emerge across sports. Netball athletes (Team 1) tend to demonstrate more velocity-oriented profiles, soccer athletes (Team 2) generally fall closer to the middle of the distribution and rugby athletes (Teams 3-7) more commonly display force-dominant profiles. These differences likely reflect the unique demands and training exposures associated with each sport and competition level.
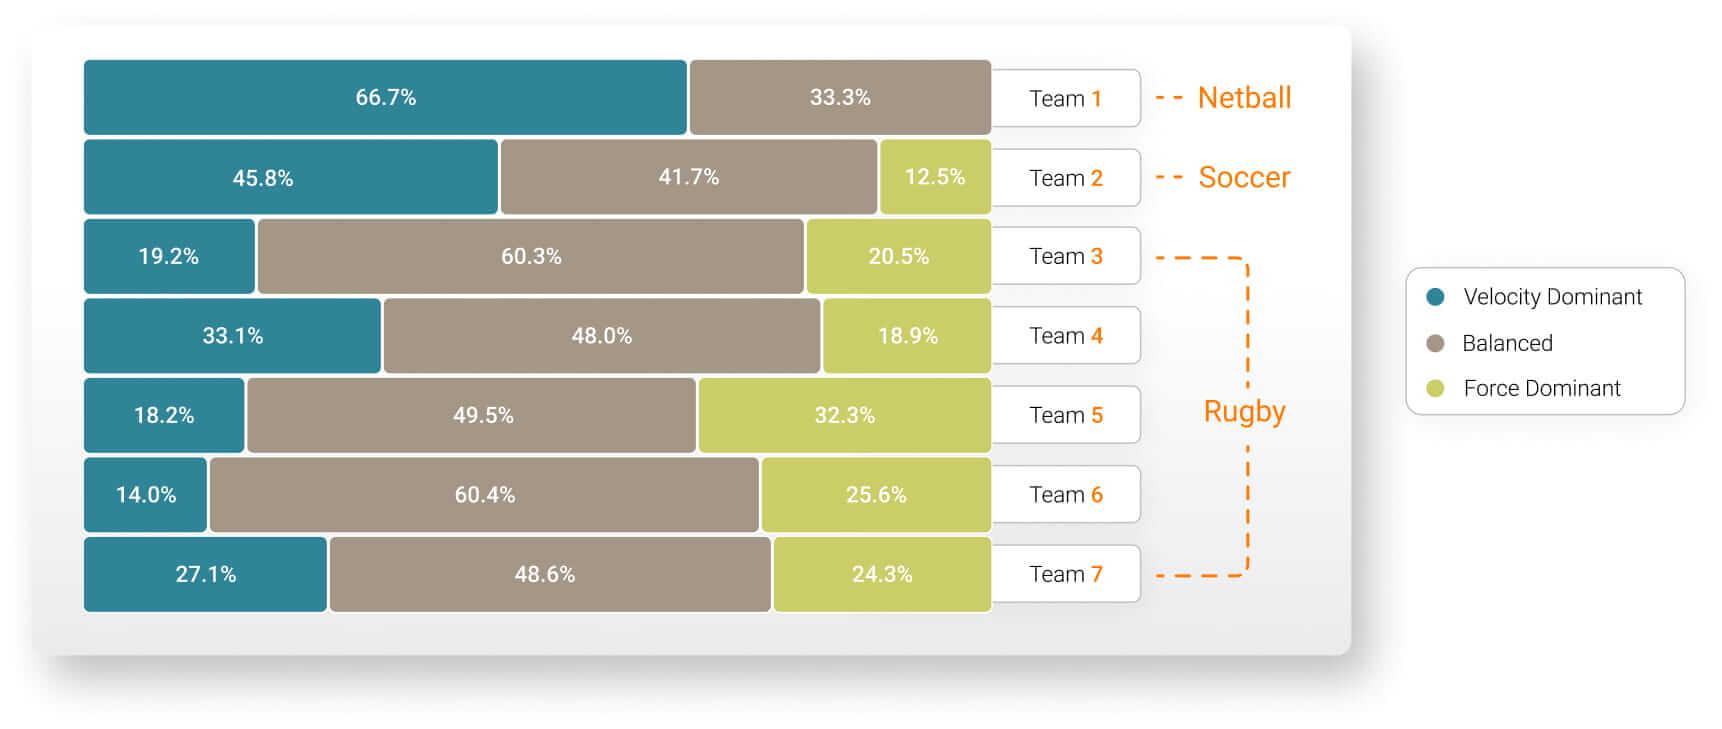
DSI profile classification by sport cohort shows a distinct trend reflecting sport demands and training history. Netball athletes are the most velocity-dominant, while rugby athletes are the most force-dominant.
Communicating DSI to Athletes
Strength profiling should be presented in a way that is interpretable, contextualized and linked to training decisions. Normalizing Iso Belt Squat and CMJ peak force to body mass reduces a major source of variation, allowing athletes to be compared against relevant norms and peers. Using platforms such as VALD Hub to plot normalized values creates a simple, practical visual for athlete feedback and practitioner decision-making.
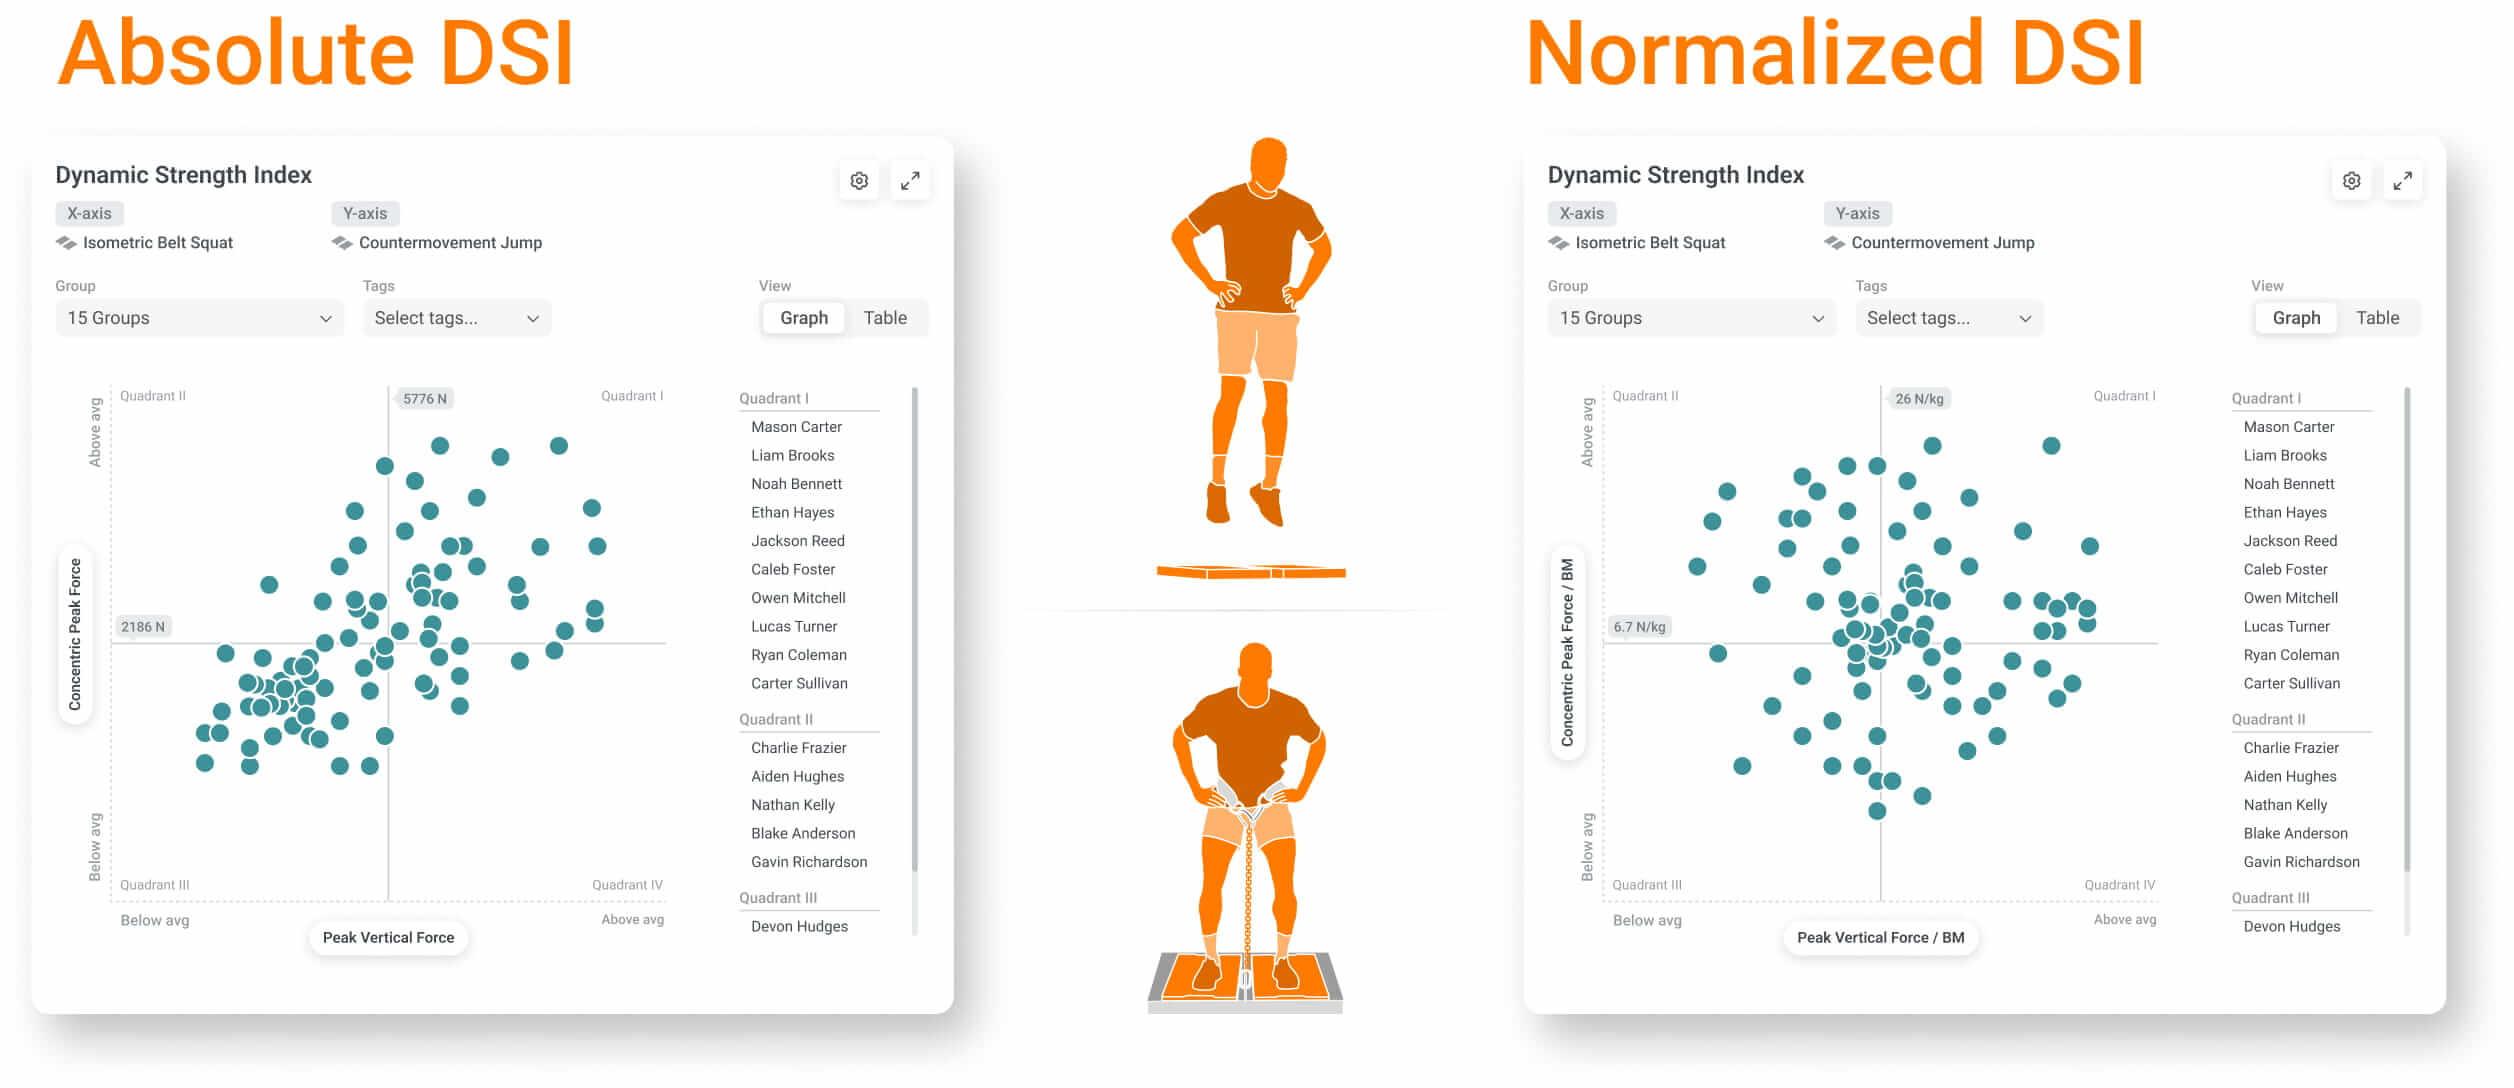
VALD Hub’s Quadrant Charts allow practitioners to plot any metric against another, including absolute metrics (left) and normalized-to-body-mass metrics (right).
This approach enables practitioners to clearly communicate current strength and force expression characteristics, while also illustrating the intended direction of the training plan.
DSI Monitoring
DSI can also be used to monitor longitudinal changes relative to expected training adaptations. VALD Hub includes DSI reporting across a range of assessment combinations, allowing practitioners to use the Monitoring Chart to review both group trends and individual athlete profiles over time.
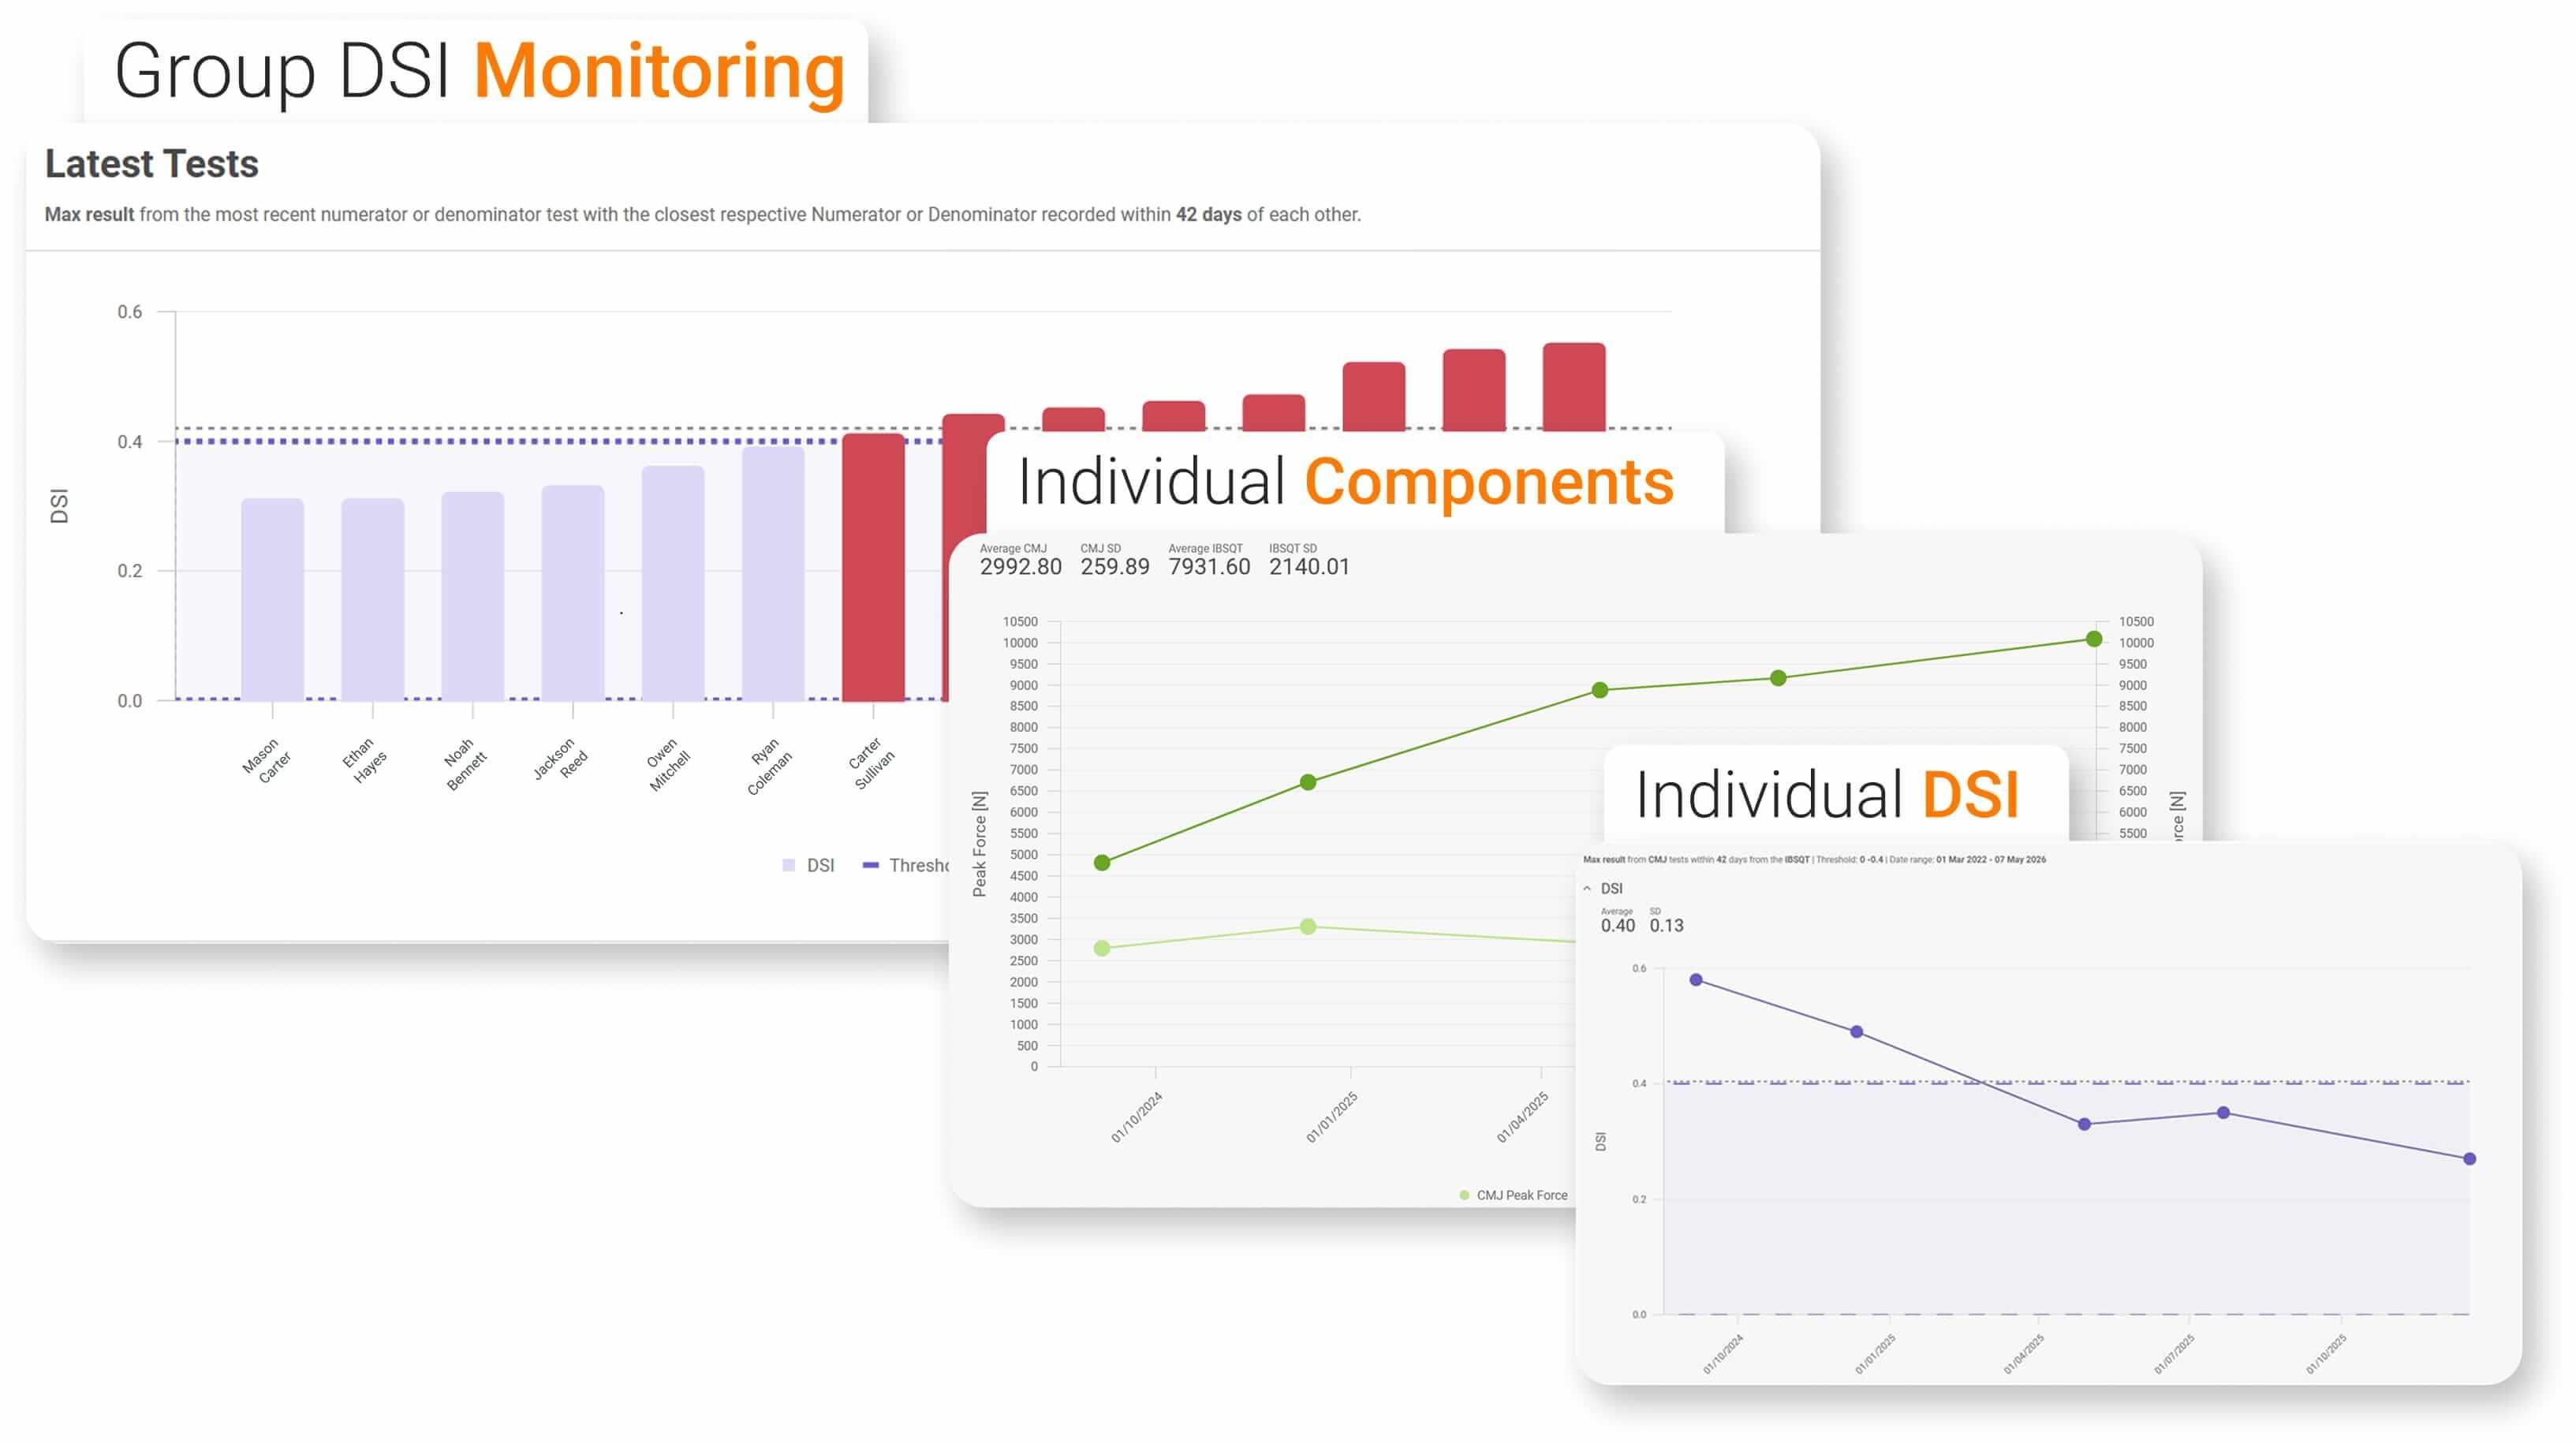
When tracked across a training cycle, changes in DSI and its contributing force measures can be interpreted alongside the intended training emphasis. As a practical guide, changes greater than ~8% in Iso Belt Squat or CMJ peak force may be considered meaningful. This is based on minimal detectable change (MDC) estimates from pilot Iso Belt Squat data and previous CMJ literature (Collings et al., 2024).
| Training Emphasis | Iso Belt Squat Peak Force | CMJ Peak Force | Expected DSI Change | Interpretation |
| Strength‑Focused Phase | ↑ | ↔ | ↓ | Improved force relative to dynamic expression |
| Speed‑Strength Phase | ↔ | ↑ | ↑ | Improved dynamic expression relative to force capacity |
| Unexpected Change – Strength-Focused Phase | ↓ | ↔ | ↑ | Possible fatigue or reduced tolerance to heavy loading |
| Unexpected Change – Speed-Strength Phase | ↔ | ↓ | ↓ | Possible reduction in readiness, coordination or movement quality |
Importantly, DSI is not a diagnostic tool. It is best used to support practitioner-athlete discussions, guide further questioning and inform training decisions.
…DSI is not a diagnostic tool. It is best used to support…discussions, guide further questioning and inform training decisions.
Applying DSI in Practice
The Iso Belt Squat adds value as both a maximal lower-body strength assessment and an anchor within broader strength profiling. It also highlights that ratio-based metrics such as DSI are only meaningful within the context of the tests used to generate them.
Recalibrated DSI bands preserve the intent of the original framework while accounting for the different constraints of the Iso Belt Squat. Importantly, DSI profiles are not judgments of ability or standalone prescriptions, but tools to guide questioning, training emphasis and longitudinal monitoring when interpreted alongside other assessments, training history and sport demands.
Ultimately, effective strength profiling depends less on individual metrics or cutoffs and more on integrating information coherently.
To learn more about implementing isometric lower-body testing or integrating the Iso Belt Squat into your testing battery, get in touch with our team.
References
- Collings, T. J., Lima, Y. L., Dutaillis, B., & Bourne, M. N. (2024). Concurrent validity and test–retest reliability of VALD ForceDecks’ strength, balance, and movement assessment tests. Journal of Science and Medicine in Sport, 27(8), 572–580. https://doi.org/10.1016/j.jsams.2024.04.014
- Sheppard, J. M., Chapman, D., & Taylor, K. L. (2011). An evaluation of a strength qualities assessment method for the lower body. Journal of Australian Strength and Conditioning, 19(2), 4–10. https://www.strengthandconditioning.org/jasc-19-2/1338-peer-review-an-evaluation-of-a-strength-qualities-assessment-method-for-the-lower-body
- Young, W. (1995). Laboratory strength assessment of athletes. New Studies in Athletics, 10(1), 89–96.
- Zatsiorsky, V. M. (1995). Science and practice of strength training. Human Kinetics.
