Integrating VALD AI into Performance, Rehabilitation and Monitoring
Available in:
EN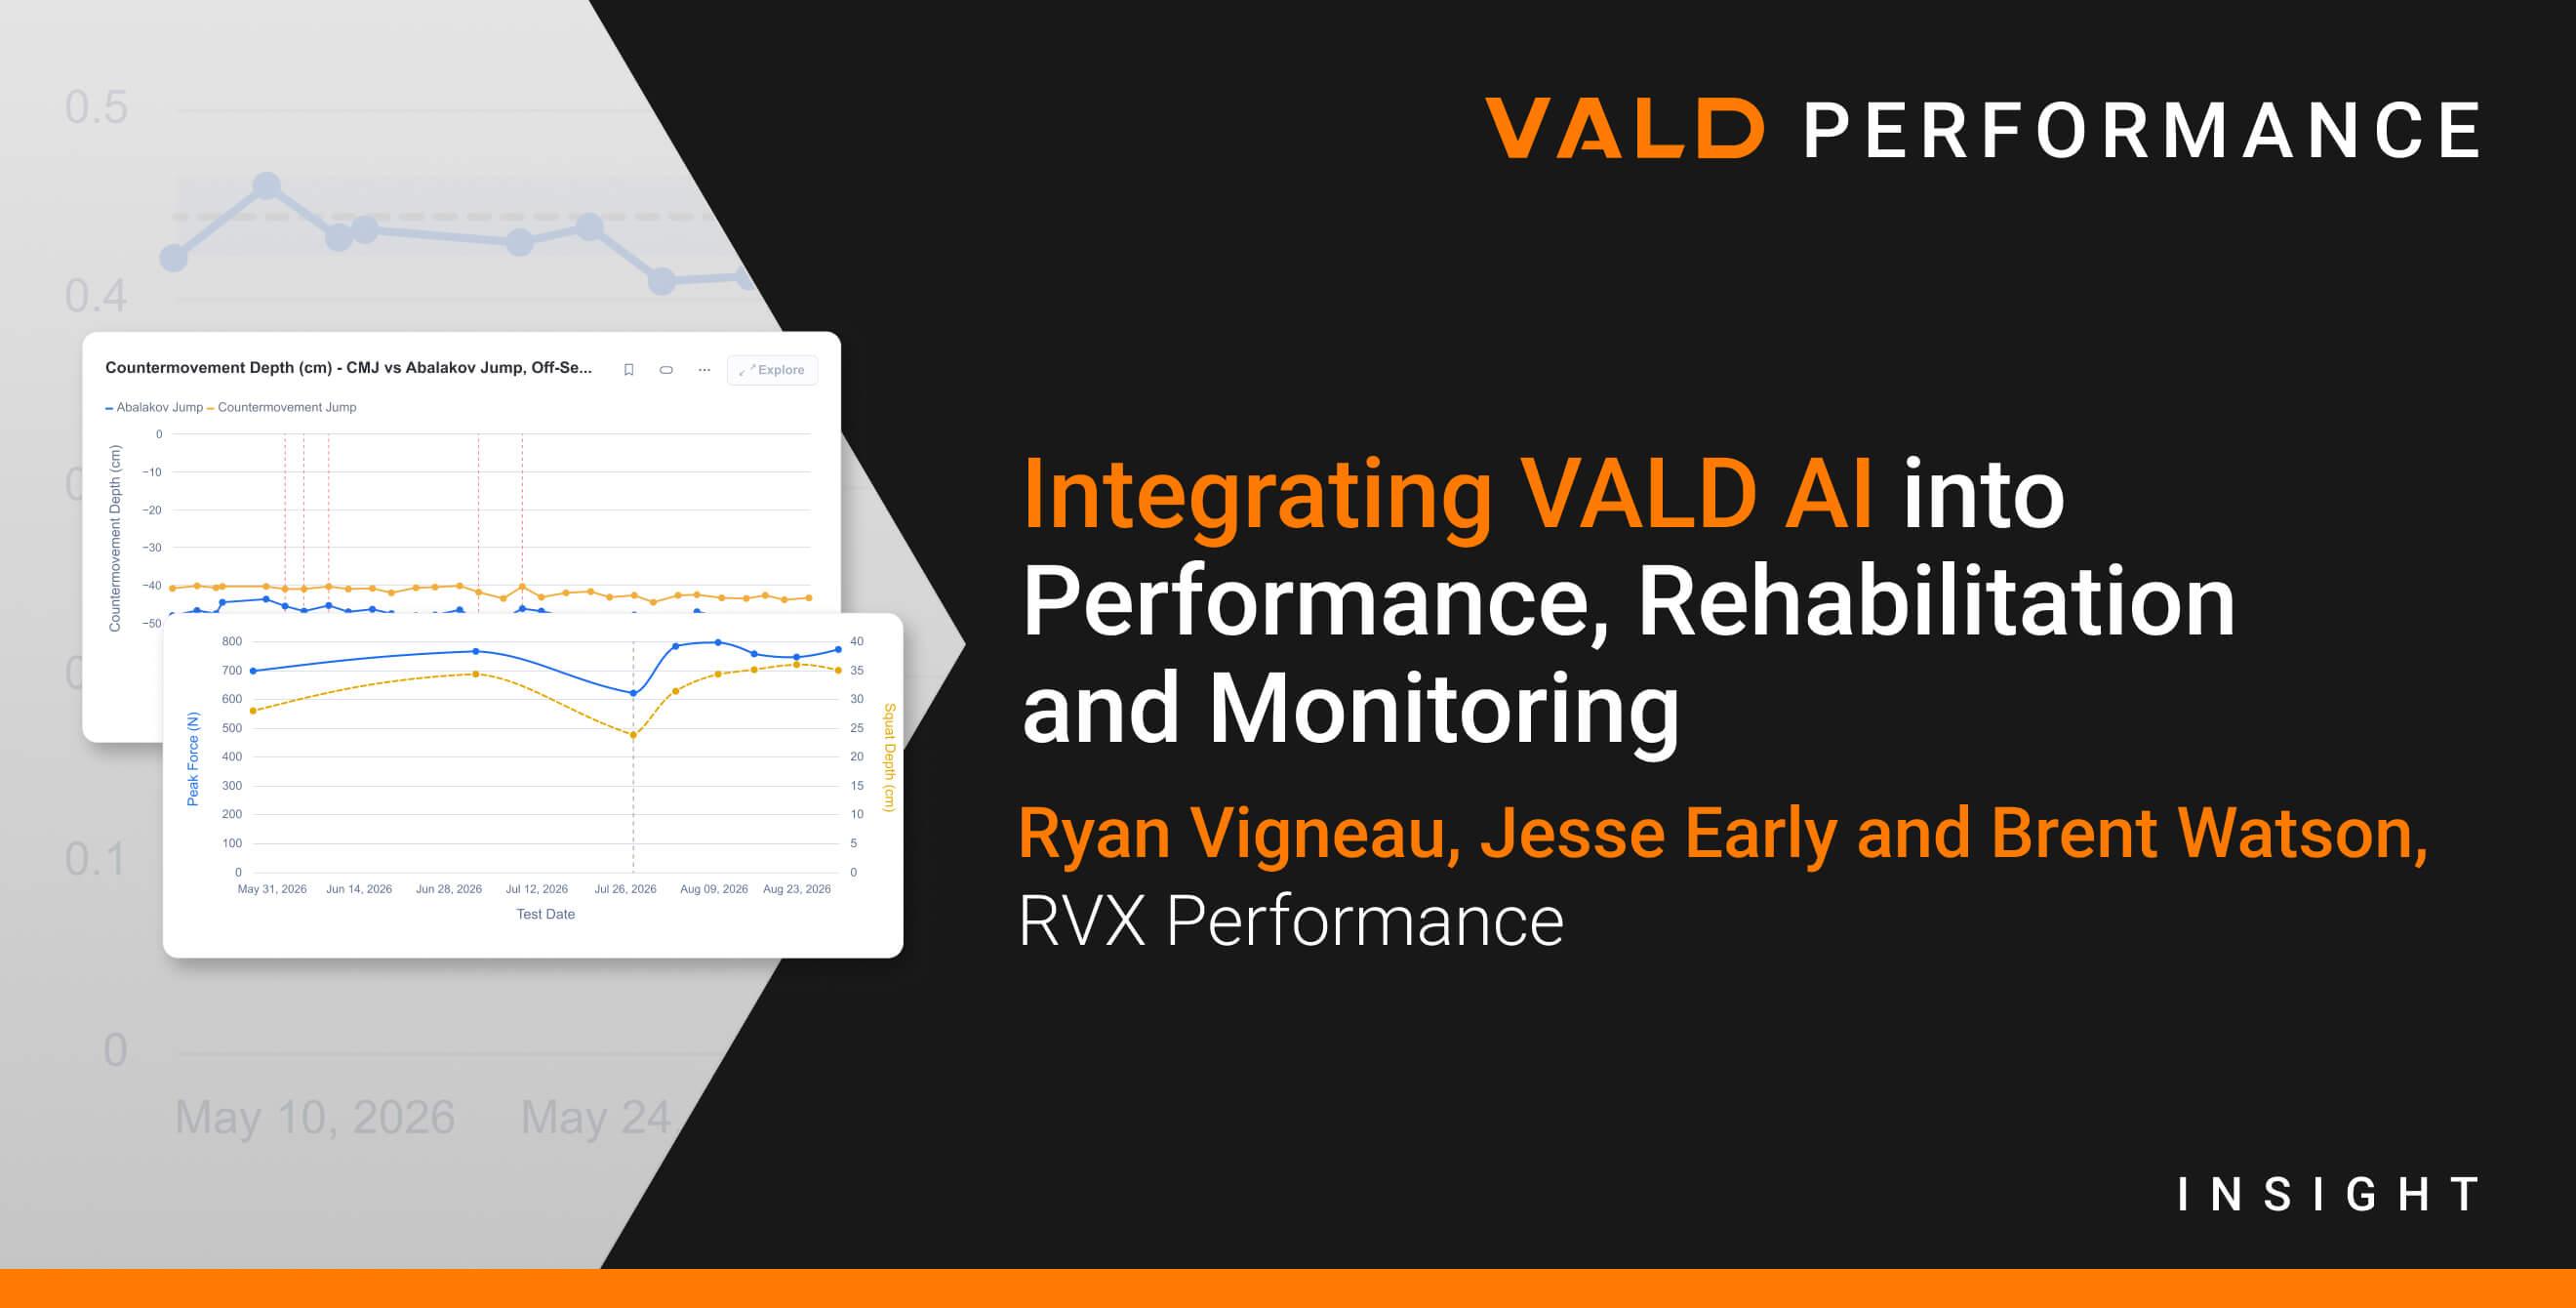
Since integrating objective testing technology into our workflow, we have recorded nearly 35,000 ForceDecks tests and 57,000 SmartSpeed tests, involving more than 1,000 athletes. As our testing database has grown, so has the need to summarize and interpret information efficiently.
This prompted us to integrate new data-processing systems to help interpret data, identify patterns efficiently and highlight performance changes more clearly. To make better sense of the large volumes of data we have collected, we began to explore VALD AI and its ability to maximize our efficiency in data recall and organization, allowing our team to focus more time and energy on coaching and testing our athletes.
For more information on VALD AI and how to join VALD’s closed beta program, read the Introducing VALD AI article:
Making More Informed Decisions
At RVX, athletes complete testing multiple times throughout their training and rehabilitation process. Over the past few years, we have worked with thousands of athletes and incorporated VALD systems into our testing, collecting a large volume of data. Although each case is unique and may require more specific testing protocols, our most common tests include:
While traditional reports display test results individually or in group monitoring dashboards for a particular squad, elite sport clients and organizations require us to interpret multiple datasets concurrently. Therefore, bespoke longitudinal monitoring and reporting, supported by AI technologies, provide better context so corresponding training decisions are informed by testing data.
While traditional reports display test results individually…elite sport clients and organizations require us to interpret multiple datasets concurrently.
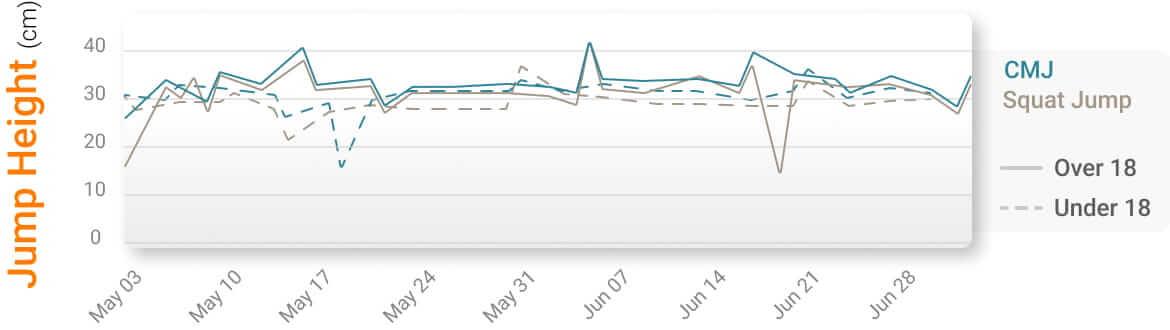
Recreated image from VALD AI comparing longitudinal assessments of CMJ and squat jump performance. Dotted lines represent athletes below 18 years of age, while solid lines indicate those above 18 years of age.
For example, using testing data from hockey athletes, VALD AI enables us to turn historical data into more useful internal benchmarks. Previously, developing bespoke norms may have required an external data scientist, whereas VALD AI allows us to create these reports directly within the VALD ecosystem.
…VALD AI allows us to…generate relevant insights more efficiently while maintaining data privacy and reducing reliance on external tools.
For organizations testing large numbers of athletes, VALD AI can also reduce the time required to interpret results. By querying data directly from VALD Hub, we can generate relevant insights more efficiently while maintaining data privacy and reducing reliance on external tools.
Tracking Off-Season Adaptation
VALD AI has helped us monitor training responses to athletes’ off-season training programs. Throughout the off-season, athletes complete strength, power, speed and agility training, while monitoring can include tracking these performance outcomes and informing injury-risk management strategies.
We use technologies such as ForceDecks and SmartSpeed to measure these changes, with VALD AI helping us summarize them across a training phase, as shown below:
| Performance Area | Example Metrics | Practical Question |
| Lower-Body Power |
| Is the athlete producing more force and power? |
| Braking and Load Absorption |
| Is the athlete improving their ability to absorb and redirect force? |
| Sprint Performance |
| Is the athlete getting faster, and where is the improvement occurring? |
| Change of Direction |
| Is the athlete improving their ability to change direction, and are asymmetries present? |
| Training Response |
| Did the training block create a meaningful adaptation? |
Rather than manually comparing each athlete’s reports, we can ask VALD AI to summarize test results or specific metrics by time block, calculate the percentage change in a test and display other test results concurrently over the same period.
…VALD AI [can] summarize test results or specific metrics by time block, calculate the percentage change in a test and display other test results concurrently over the same period.
This helps us identify associations within the data and track responses to training programs. For example, exploring relationships between metrics helps us determine whether a given training program improves all intended qualities or supports only certain adaptations.
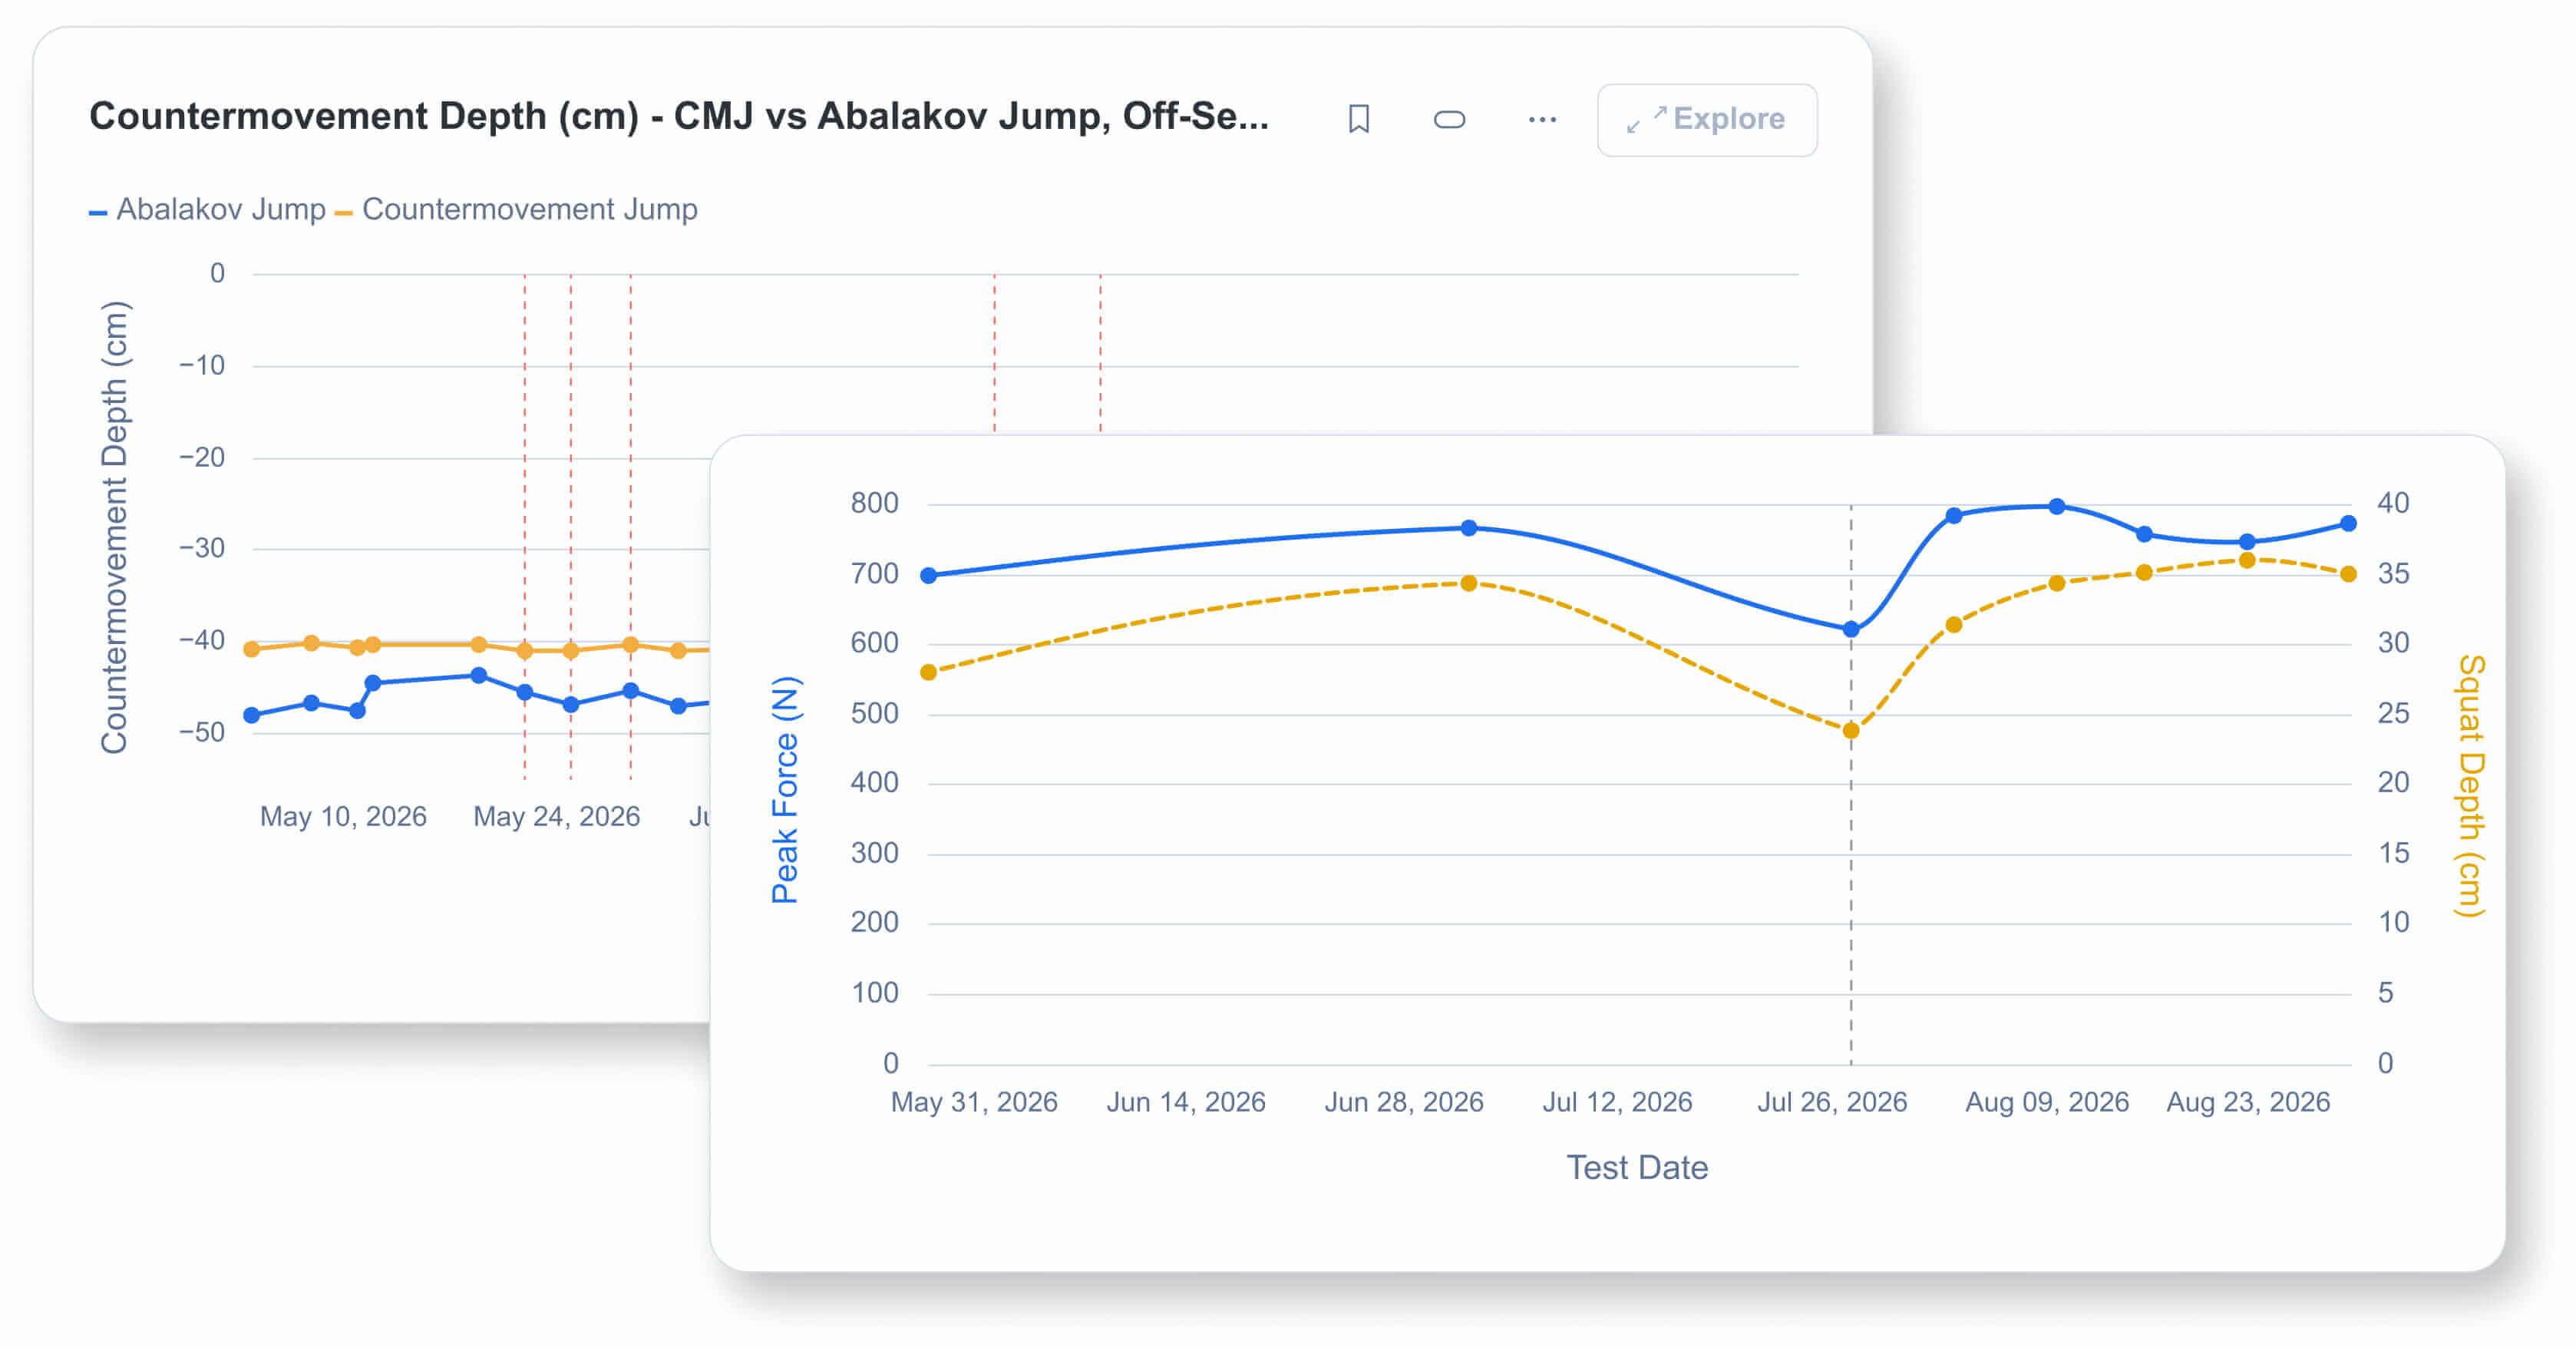
Two graphs captured directly from VALD AI showing longitudinal trends from ForceDecks CMJ and Abalakov jump assessments.
VALD AI can present relevant test trends together while we use testing context, technical observation and programming history to interpret the data. By using VALD AI to summarize and compare these datasets, we can better understand how our athletes are responding to off-season training and make adjustments more efficiently.
By using VALD AI to summarize and compare these datasets, we can better understand how our athletes are responding to off-season training…
Using VALD AI to Support Decision-Making and Establish Norms
Programming decisions remain based on objective testing, athlete feedback and practitioner observation. VALD AI supports this process by calculating, organizing and visualizing selected data rather than assigning meaning or prescribing a training response.
VALD AI can generate internal normative data for specific cohorts, allowing our team to identify group and individual trends. For example, we could calculate percentile distributions for CMJ reactive strength index-modified (RSI-Mod) in male U18 hockey athletes and compare an athlete against that reference group while considering factors such as age and maturation (Moran et al., 2017).
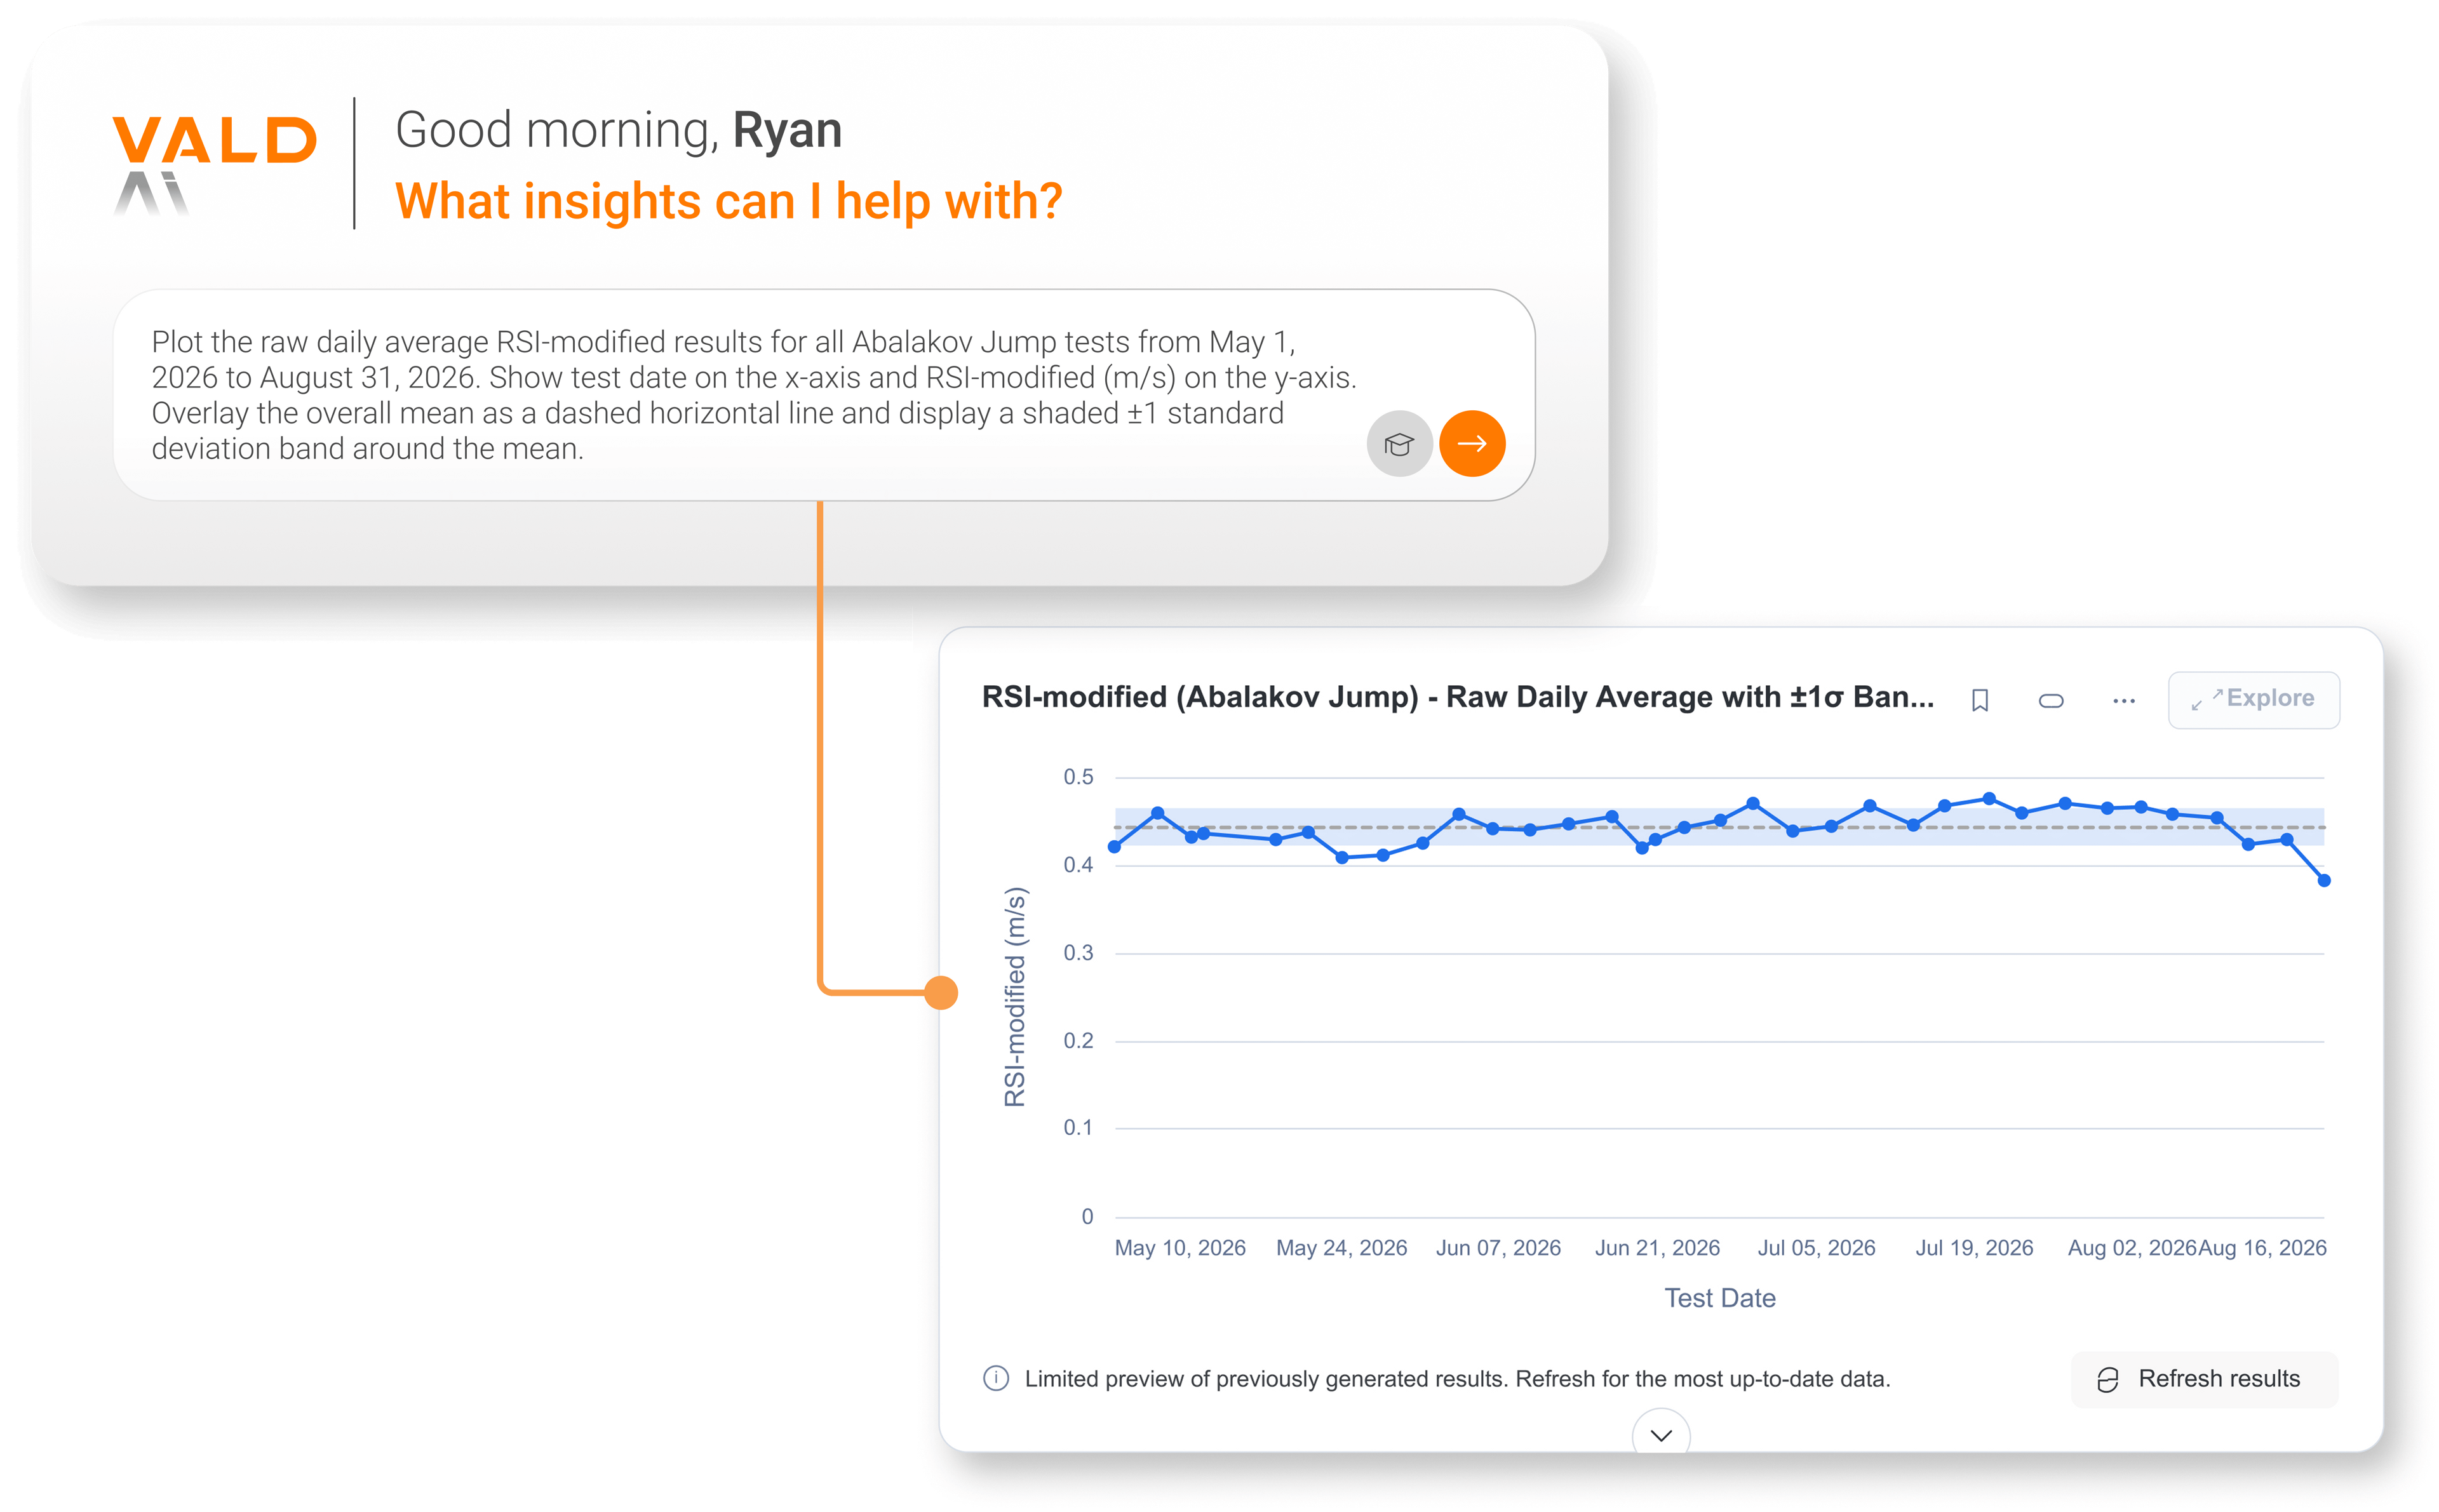
Using VALD AI, RVX identifies group and individual trends against internal norms.
VALD AI can also summarize changes over time, identify outliers for review and support return-to-performance monitoring. Using our database of ForceDecks and SmartSpeed assessment results, we can compare our athletes’ current and historical results and contextualize them against populations specific to their training environment.
VALD AI can…summarize changes over time, identify outliers for review and…contextualize [those results] against populations specific to their training environment.
Integrating VALD AI into Preexisting Workflows
Athletes respond best to relevant information about their process delivered in a clear manner rather than a list of metrics. VALD AI can aggregate selected data into a preferred format and run calculations on existing results, allowing us to build more focused summaries. This supports our performance reviews, rehabilitation check-ins and off-season progress reports by summarizing key points first, then backing them with the full dataset to support athlete conversations.
Before VALD AI, data exploration often required either more time than we had available or reliance on less reliable external LLMs.
Integrating VALD AI alongside our assessment technology and VALD Hub allows us to move more efficiently from collecting and organizing data to interpreting and applying it. Throughout this process, we remain at the center of decision-making, with VALD AI supporting rather than replacing that role. By making the underlying data easier to access and understand, VALD AI allows us to spend more time focusing on the decisions and conversations that support our athletes.
If you are interested in learning how you can integrate VALD AI into your workflow, get in touch with our team.
References
- Moran, J., Sandercock, G. R. H., Ramírez-Campillo, R., Meylan, C. M. P., Collison, J., & Parry, D. A. (2017). Age-related variation in male youth athletes’ countermovement jump after plyometric training: A meta-analysis of controlled trials. Journal of Strength and Conditioning Research, 31(2), 552–565. https://doi.org/10.1519/JSC.0000000000001444
