Using Technology to Make Better Decisions in Youth Sport
Available in:
EN

Modern performance technology, such as ForceDecks, NordBord and the suite of VALD systems, makes it easier than ever to collect data on young athletes. A squad can complete a testing session, with results available on a dashboard almost immediately, allowing coaches to identify the strongest students, most powerful teams, the highest jumpers and those performing below the group average. However, collecting more data also creates challenges in analysis and interpretation, particularly when determining how to use the results in practice.
This highlights an important distinction between profiling athletes and using testing to support coaching decisions. Profiling has a place, particularly when working with large groups, but the result itself is rarely the end point. At SHORE, reviewing student testing data has reinforced the value of looking beyond where a student ranks to understand their progress, investigate changes in performance and inform decisions around training and rehabilitation.
For more information on profiling youth performance and school-based testing, explore the Benefits of VALD Technology in Physical Education and Seasonal Kinematic Profiling in Female High School Athletics articles.

Looking Beyond the Age-Group Average
Age-group comparisons are a practical starting point in youth sport. They provide a reference for individual results and make large datasets easier to interpret. However, students of the same age can still differ considerably in physical development, training history, body size and familiarity with testing. An age-group reference can show where a student ranks within a group based on their performance, but individual variations in development and athleticism mean that not all age-group comparisons are created equal.
This was evident in the preliminary analysis of countermovement jump (CMJ) performance data collected using ForceDecks. Among 15-year-olds, the middle 50% of jump-height results spanned 23.6-31.3cm, giving an interquartile range of 7.7cm, while the difference between the median results for 14- and 15-year-olds was 2.4cm. In fact, variation within the 15-year-old group exceeded the difference between the two age-group medians.
…variation within the 15-year-old group exceeded the difference between the two age-group medians.
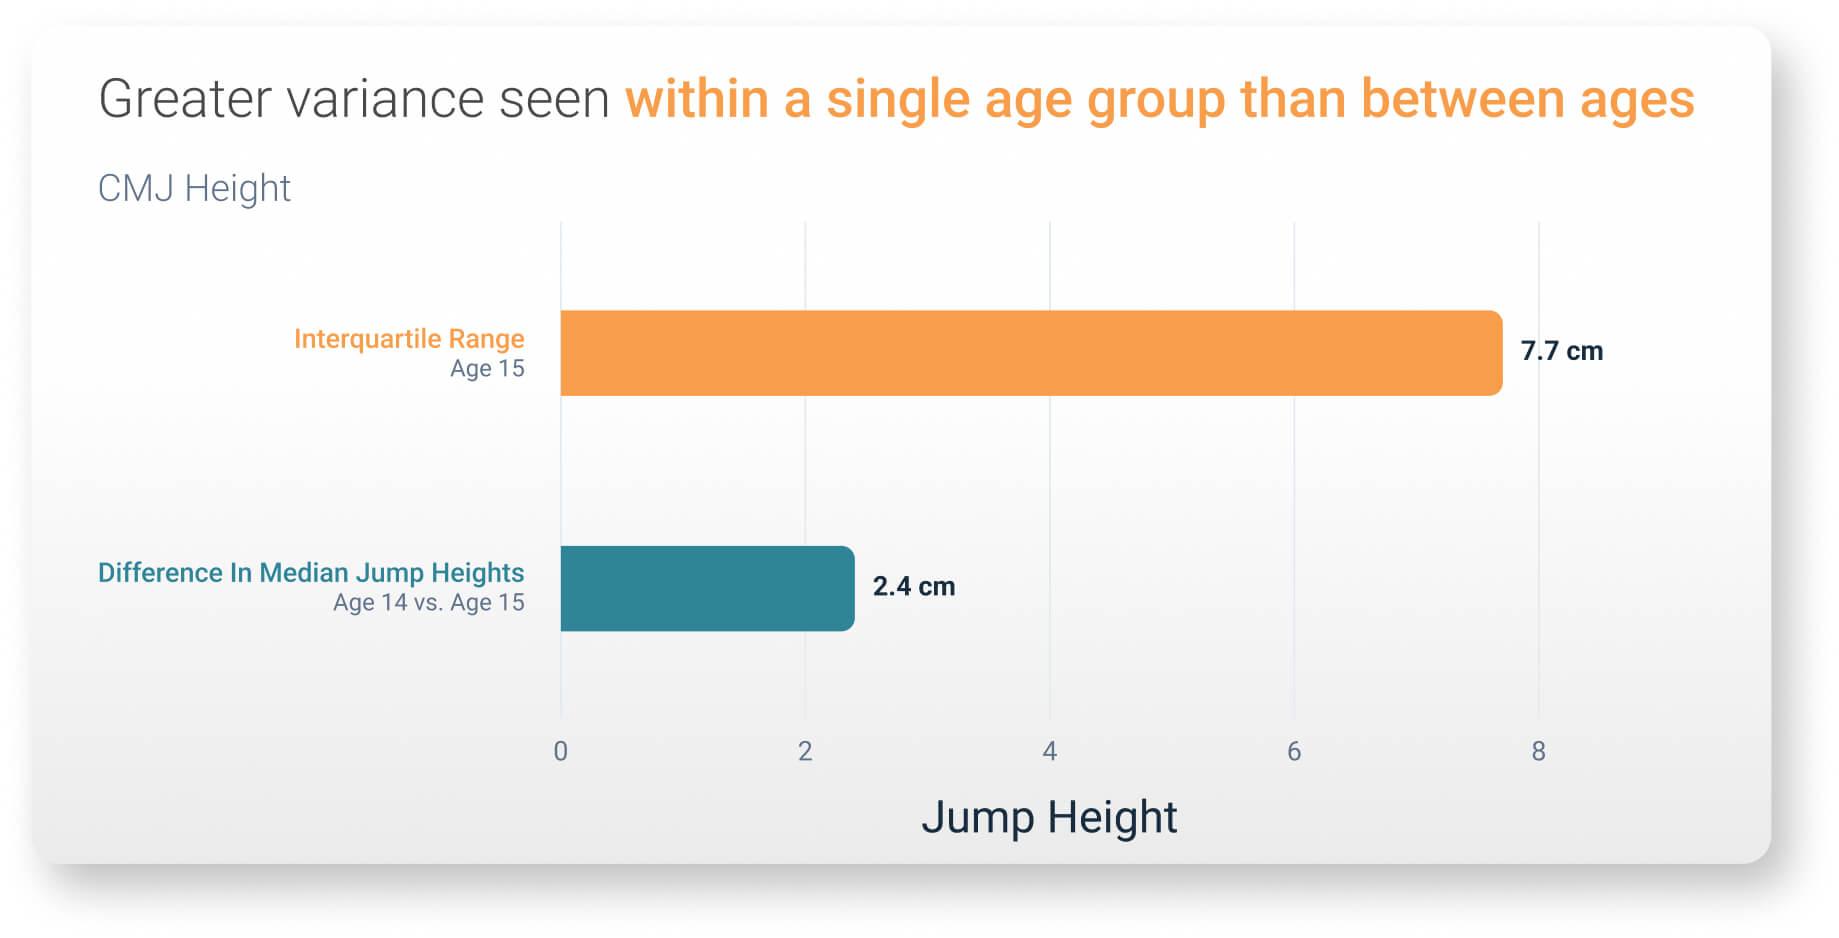
For practitioners, this variation is important when interpreting students who perform below age-group reference values. Originally created using VALD AI, the above graph illustrates how performance can vary considerably within the same age group. While lower results may warrant further investigation, they do not necessarily indicate a physical limitation or require training changes. When interpreting group comparisons, consider factors such as training history, test familiarity, body size and other physical qualities.
Longitudinal data provide additional context. A student performing below an age-group reference may still demonstrate meaningful improvements relative to their previous results. Practitioners should therefore consider individual performance trends alongside group benchmarks and current training demands before making programming decisions.
Understanding What the Measure Represents
Body mass provides another example of why the reported measure needs to match the question being asked. When analyzing the performance of 890 students with VALD AI, we discovered that heavier students tended to produce higher absolute CMJ force and power. However, those relationships were substantially weaker when force and power were expressed per kilogram of body mass.
…those relationships were substantially weaker when force and power were expressed per kilogram of body mass.
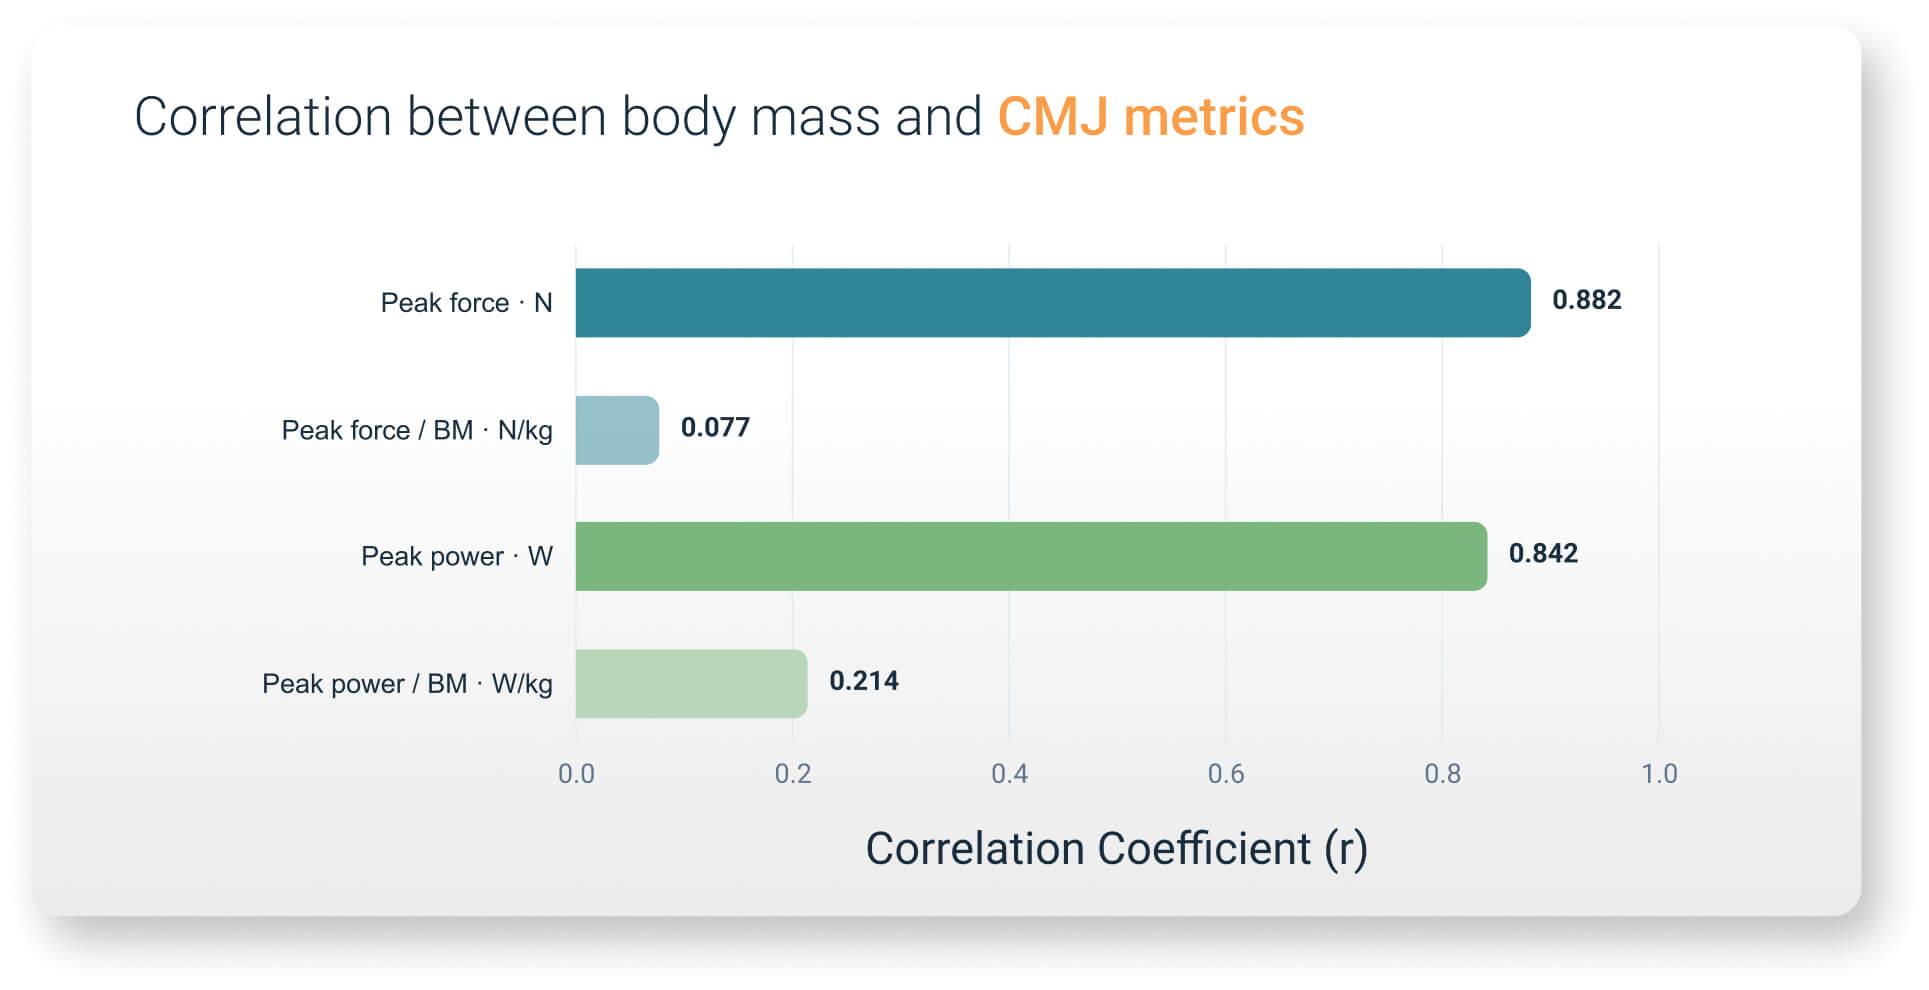
Reported correlations between body mass and absolute and per-kilogram CMJ peak force and peak power (n = 890).
Neither approach provides a complete answer on its own. Absolute force describes the total force produced, while force relative to body mass provides information that helps practitioners interpret a student’s output in relation to their size. If two students differ considerably in body size, comparing only absolute force or power may provide an incomplete picture. At the same time, dividing every measure by body mass does not automatically make the comparison appropriate.
Each metric is selected and interpreted based on the student, the purpose of the assessment and the question it is intended to answer. A dashboard brings these measures together, providing context for interpreting results and informing decision-making.
Tracking Student Performance Over Time
Regular, standardized testing establishes an individual performance history, providing context that a single assessment or ranking cannot. Tracking results over time helps identify meaningful improvement or decline relative to a student’s typical performance, provided testing protocols and instructions remain consistent.
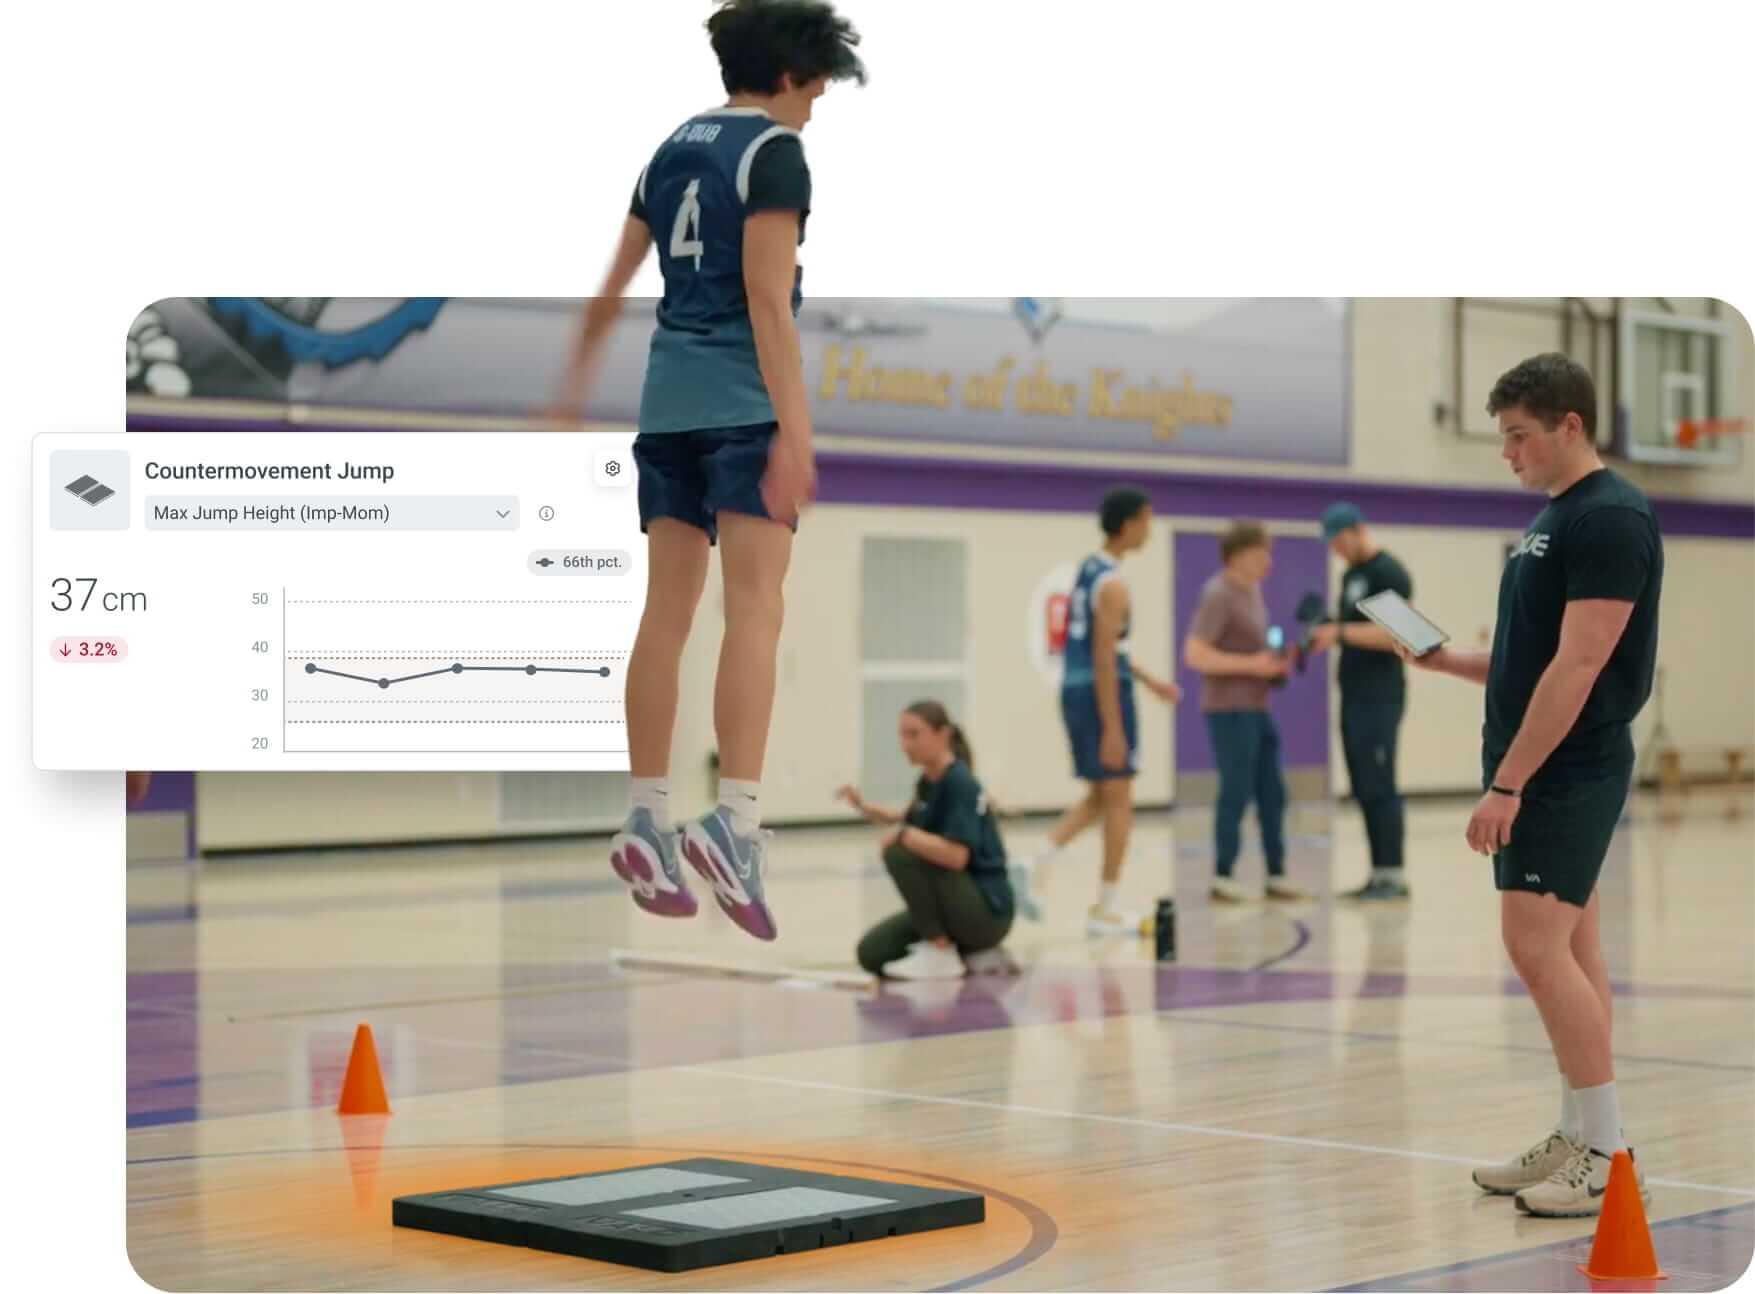
A single lower result should not automatically change the program. First, confirm the test was comparable with previous assessments. Then interpret the result alongside recent training, competition, symptoms and recovery.
The same applies in rehabilitation. Objective testing should complement symptoms, clinical assessment and activity progression, providing additional context for decision-making.
Connecting Testing with Context
A testing dashboard becomes more useful when results can be tracked over time and interpreted alongside training and competition demands. In this dataset, VALD AI was used to support further analysis, identify performance trends and provide additional context for interpreting individual and group results. Changes in performance were then used to prompt practitioners to consider whether further investigation, continued monitoring or training adjustments were appropriate.
A testing dashboard becomes more useful when results can be tracked over time and interpreted alongside training and competition demands.
This dataset did not include linked workload or clinical records and therefore cannot establish injury risk or workload tolerance. Instead, it provides reference points that practitioners can combine with the information they already use in coaching and rehabilitation.
Before adding another test or metric, consider three questions:
- What decision could this result inform?
- What other information is needed to interpret it?
- Who will review the result and act on it?
If these questions cannot be answered, collecting additional data is unlikely to improve decision-making.
Maximizing the Value of Testing
Technology allows practitioners to measure young athletes consistently and track change over time. Age-group references provide context for comparison, while previous results and individual circumstances help determine whether a change is meaningful.
The value of testing is not the amount of data collected but how effectively that information supports decisions. Practitioners should leave a testing session with a clearer understanding of the athlete and a rationale for what happens next.
If you would like to learn more about how VALD technologies can support objective testing, performance monitoring and informed decision-making in youth sport, get in touch with our team.
