Youth Development in Ice Hockey
Available in:
EN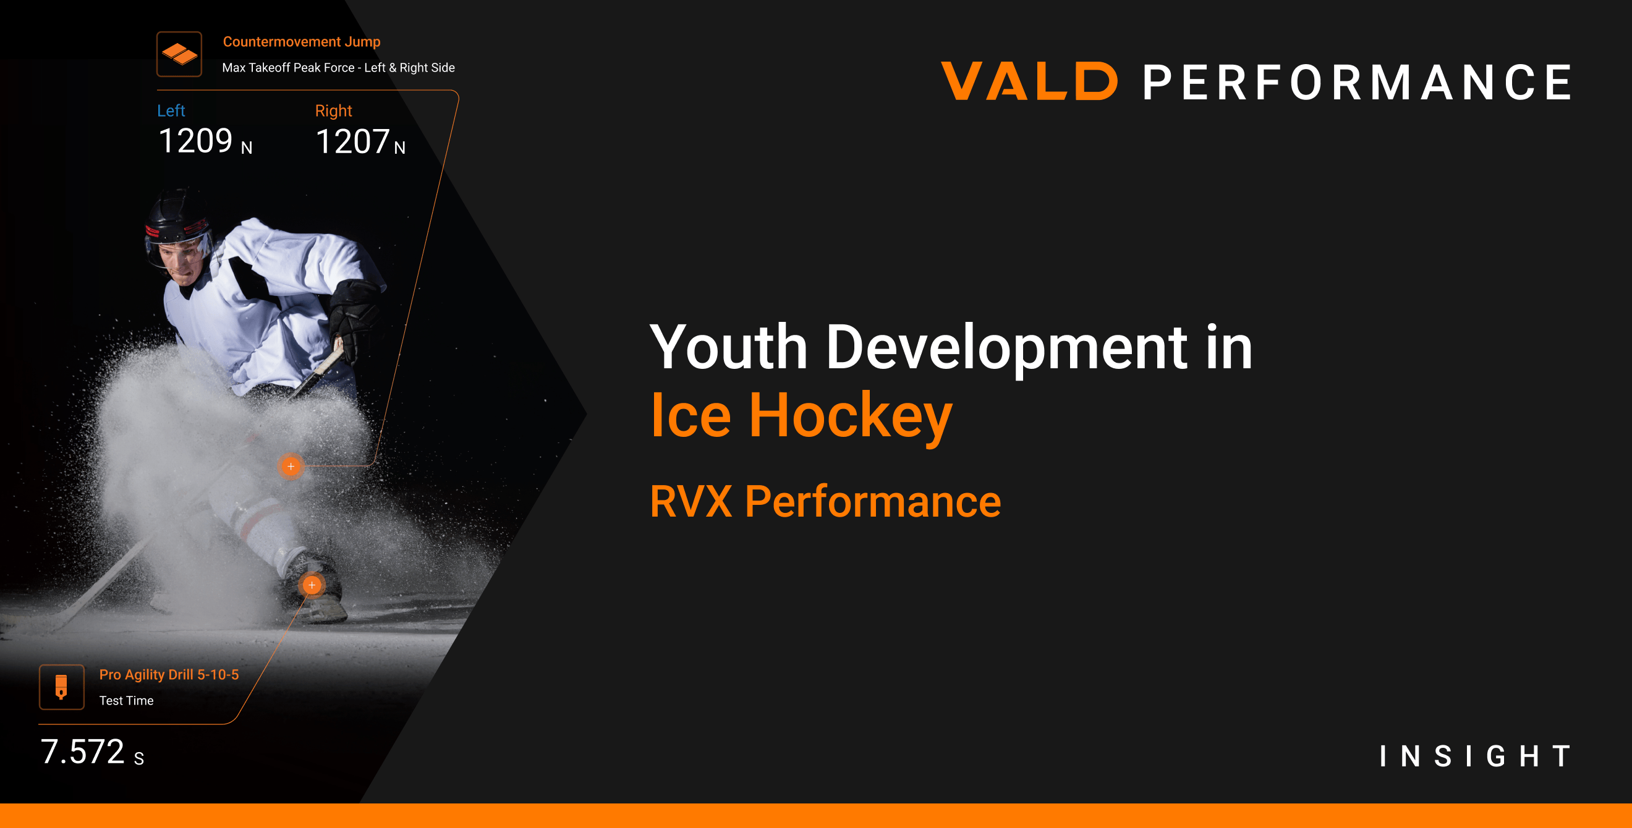
About the Authors
RVX Performance is a sports performance facility operating in Edmonton, Alberta, Canada. In this blog, RVX President Ryan Vigneau, Head Performance Coach Jesse Earley and Performance Coach Brent Watson share insights from their decades of experience in elite strength and conditioning, working with athletes in figure skating, ice hockey, track and field, volleyball and basketball.
This article explores the physiological and neurological changes youth athletes experience, the challenges they face in balancing intense schedules and how advanced tools such as ForceDecks and SmartSpeed can optimize their development.
The Need for Quality Testing in Youth Athletics
When working with athletes between the ages of 8 and 14, we have found that their development is shaped by multiple factors, but neural maturation is one of the most influential. During this critical window, improvements in motor unit recruitment, firing rates and movement coordination lay the foundation for speed, agility and overall performance.
At this stage, traditional strength tests – such as the squat or bench press – are often poorly suited to younger athletes. They provide limited value and may fail to capture meaningful progress.
As adolescents grow, hormonal changes and rapid shifts in height and body mass further complicate the picture. Research shows that while gains in muscle mass, height and weight often peak around the same time, individual growth trajectories cause strength, speed and power to develop in unpredictable, nonlinear ways (Philipaerts et al., 2006).
…strength, speed and power [gains in youth athletes] develop in unpredictable, nonlinear ways.
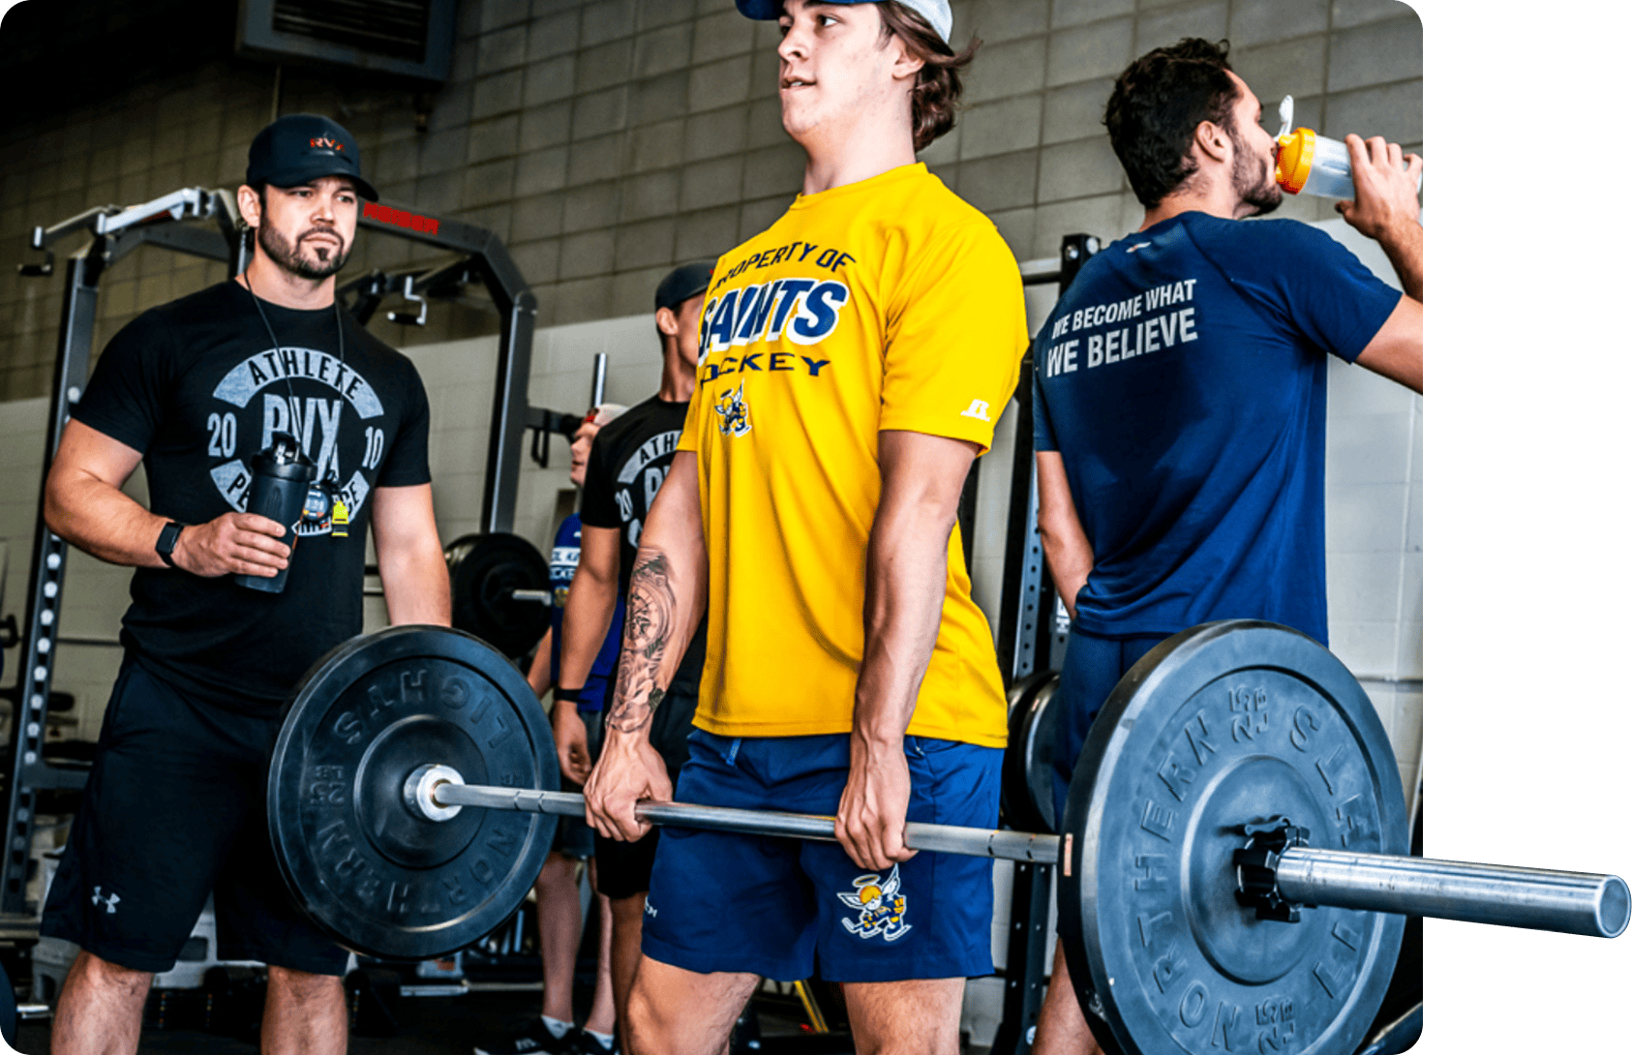
RVX athlete weight training based on their individualized performance program.
Some athletes may follow a typical strength progression with no issues, while others may temporarily regress during peak height velocity, highlighting the need for individualized programming. This is where we have found that technology best helps our long-term athletic development (LTAD) process.
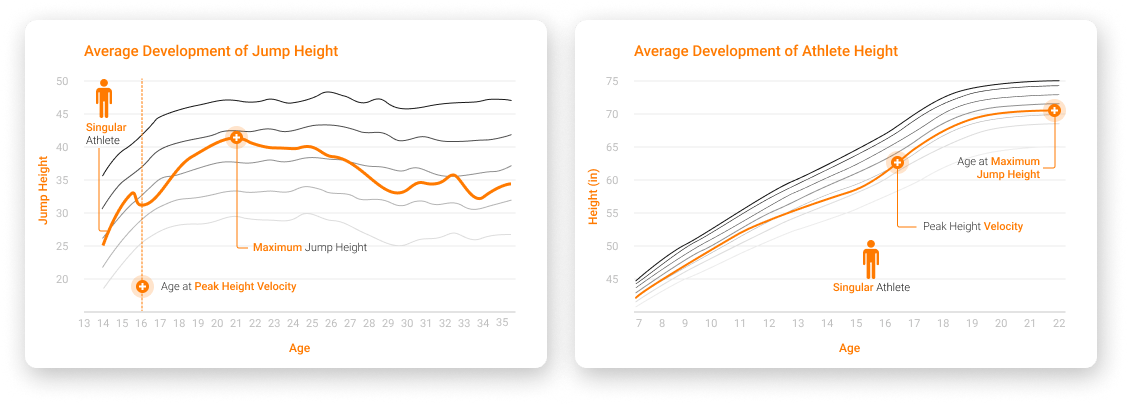
Graphs representing an athlete’s physical and athletic development differences from peak height velocity to peak jump performance.
Technology-enabled assessments, such as jump testing with ForceDecks and speed testing with SmartSpeed, provide objective data on neuromuscular performance. Tracking trends in metrics such as jump height and reactive strength index allows practitioners to identify plateaus, regressions or rapid improvements in performance – enabling timely adjustments to training loads and ensuring LTAD stays on track.
Tracking trends in metrics such as jump height…[enables] timely adjustments to training loads and [ensures] LTAD stays on track.
Technology and LTAD
ForceDecks are a cornerstone of our LTAD program, offering precise, objective data that goes beyond what the eye can see. They are especially valuable for identifying asymmetries or inefficient movement patterns in growing athletes. Given the nonlinear nature of maturation and athletic development, ForceDecks enable us to individualize training based on biological age, not just chronological age, ensuring each athlete receives the right stimulus at the right time.
RVX athlete performing a countermovement jump (CMJ) on ForceDecks with high physical outputs displayed.
ForceDecks’ calculation methods for jump height, such as the impulse-momentum equation, allow practitioners to remain confident in outcome accuracy, despite changes in technique.
By tracking long-term trends rather than isolated data points, ForceDecks provides deeper insight into performance patterns and evolving jump strategies shaped by growth and development – making it essential to our LTAD program.
By tracking long-term trends rather than isolated data points, ForceDecks provides deeper insight into performance patterns…shaped by growth and development…
In ice hockey, where explosive power and speed are critical, monitoring metrics such as jump height, eccentric rate of force development (RFD) and jump asymmetry helps coaches identify performance opportunities and tailor training accordingly. These data-driven adjustments support the development of stronger, faster and more resilient athletes.
A Deeper Dive into LTAD and Force Plates
Effectively managing LTAD in youth athletes requires objective data to guide decisions across growth, performance and readiness. The table below outlines key considerations, relevant metrics and the rationale for their use in youth development programs.
| Consideration | Key Metrics | Rationale |
| Growth and Development | CMJ: Peak power Drop jump (DJ): Ground contact time | Tracks changes in movement mechanics during growth spurts, allowing for training adjustments when significant changes occur. |
| Asymmetry Identification | CMJ: Eccentric deceleration impulse asymmetry, force at zero velocity asymmetry | Detects imbalances in movement strategy during different phases of movement, allowing for better training changes and injury risk detection. |
| Training Adaptation | CMJ: Jump height DJ: Ground contact time, jump height | Informs selection of specific volumes of strength or plyometric training to match developmental goals. |
| Readiness and Fatigue Monitoring | CMJ: Jump height DJ: Reactive strength index | Helps assess daily readiness amid demanding schedules and developmental changes. |
Force plate metrics…[provide] insights [that] lead to smarter, safer and more individualized training throughout youth development.
Force plate metrics enable practitioners to gain a deeper understanding of athlete performance and injury risk. In turn, these insights lead to smarter, safer and more individualized training throughout youth development.
Technology in Practice: What Is Best for Youth?
Force plates are often seen as high-performance tools, but their application in LTAD is simple and highly effective. For most youth athletes, simple tests such as the CMJ and DJ deliver actionable insights without unnecessary complexity.
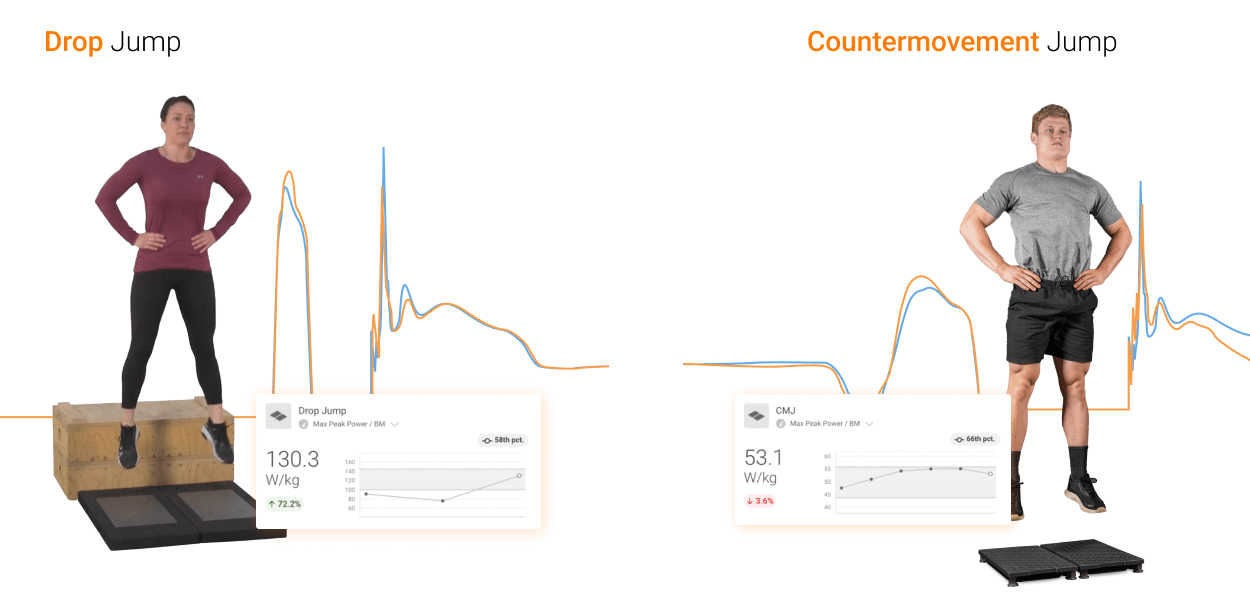
DJ and CMJ performed with corresponding peak power metrics displayed.
We align our test selection with each athlete’s stage of physical and neurological development. By assessing age-appropriate performance markers, we can identify which athletes are ready to progress to advanced testing – and which are still building foundational strength and coordination.
For younger athletes (typically under 14), we prioritize simpler tests (e.g., CMJ) and basic outputs (e.g., jump height, peak power). At this stage, our focus is on movement quality and consistent execution – key elements that support future development.
As athletes mature, testing evolves. With greater physical capacity and training experience, we expand the assessment battery to include more complex tools such as DJs and isometric strength tests. These allow for deeper analysis, including eccentric RFD and phase-specific force metrics, helping to fine-tune performance strategies for the individual athlete.
As athletes mature, testing evolves …[and detailed metrics help] fine-tune performance strategies for the individual athlete.
We have integrated force plate assessments with complementary tools like SmartSpeed timing gates to gain a more comprehensive view of each athlete’s physical development. This approach also helps us identify which metrics change in parallel with speed performance, guiding targeted areas for further improvement.
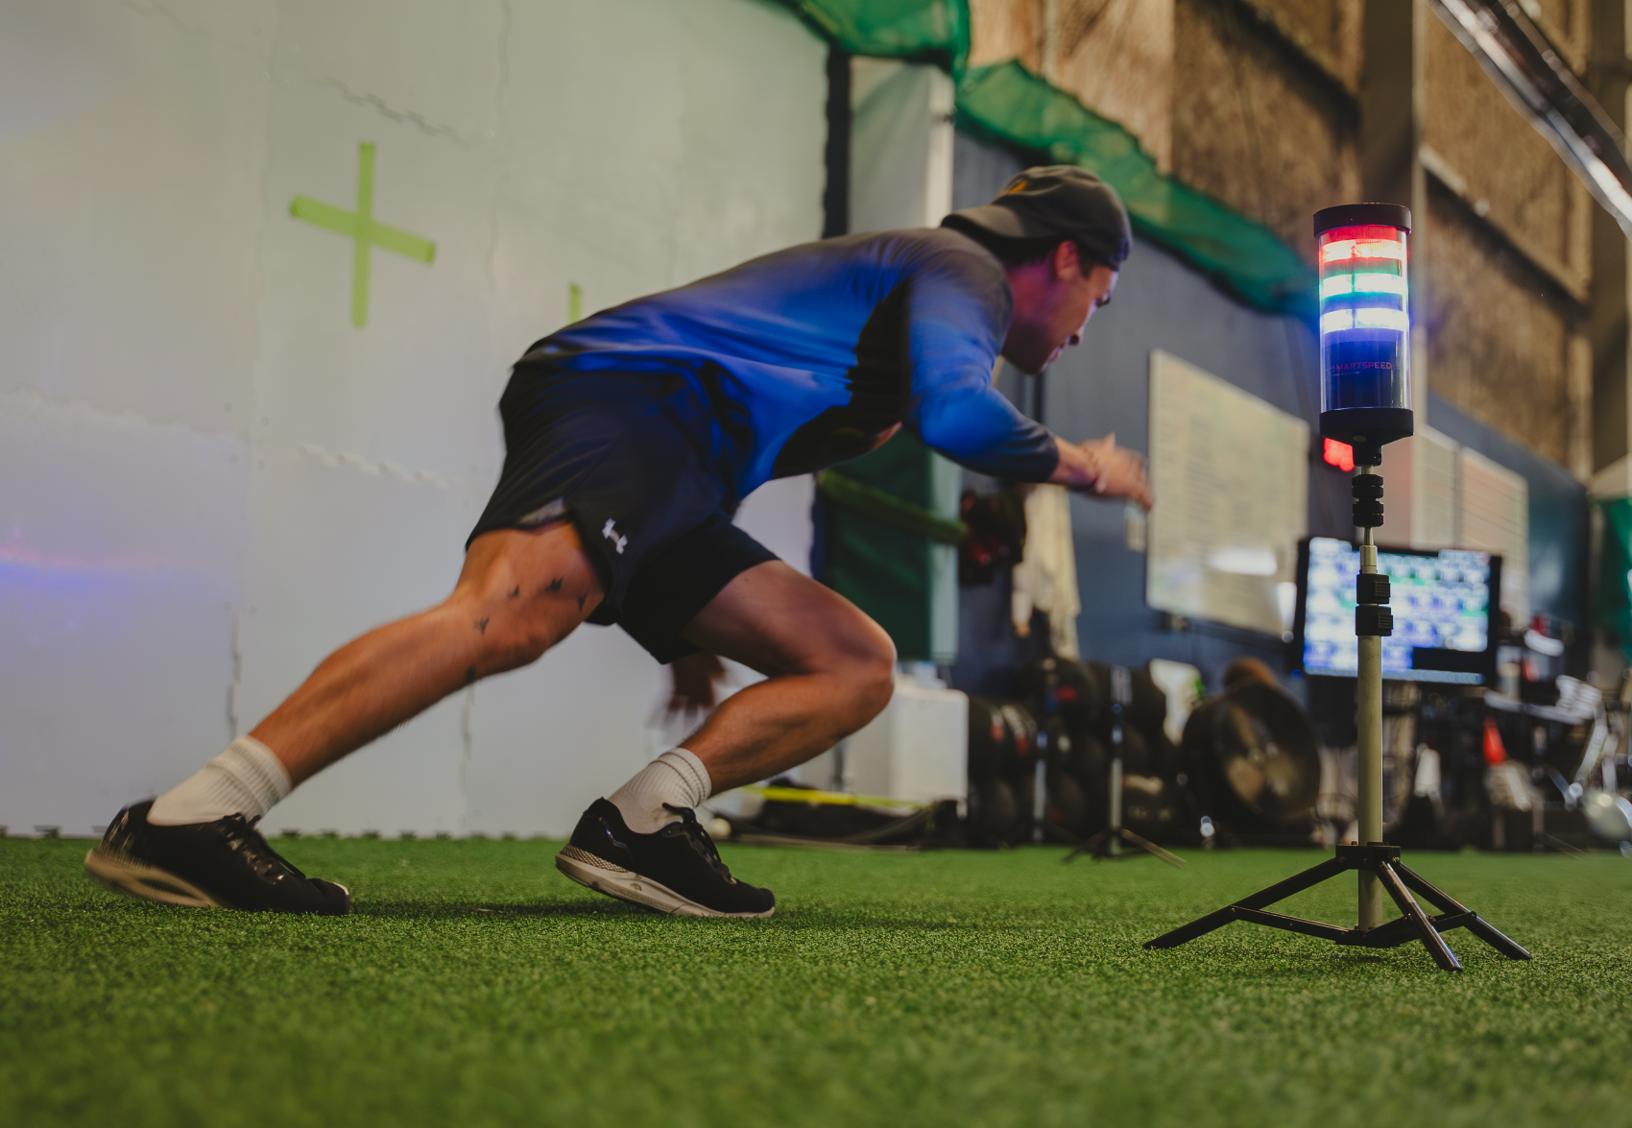
Change of direction drill captured using SmartSpeed Pro.
Case Study: Four-Year Athlete Development
Over the past five years of integrating VALD technology into our training system, we have become accustomed to using VALD’s Norms as we consistently compare our year-round athlete testing within VALD Hub. One standout example began in 2020, with a 14-year-old hockey player who was looking to improve his on-ice performance.
Initial force plate testing revealed a 15% asymmetry in both concentric and eccentric phases of his CMJ. Given his age and physical stature at the time (5ft 3in, 125lbs), we anticipated that he was approaching a key growth phase. Over the next four years, consistent testing tracked fluctuations in asymmetry – peaking at 34% – before ultimately dropping below 5% by summer 2024.
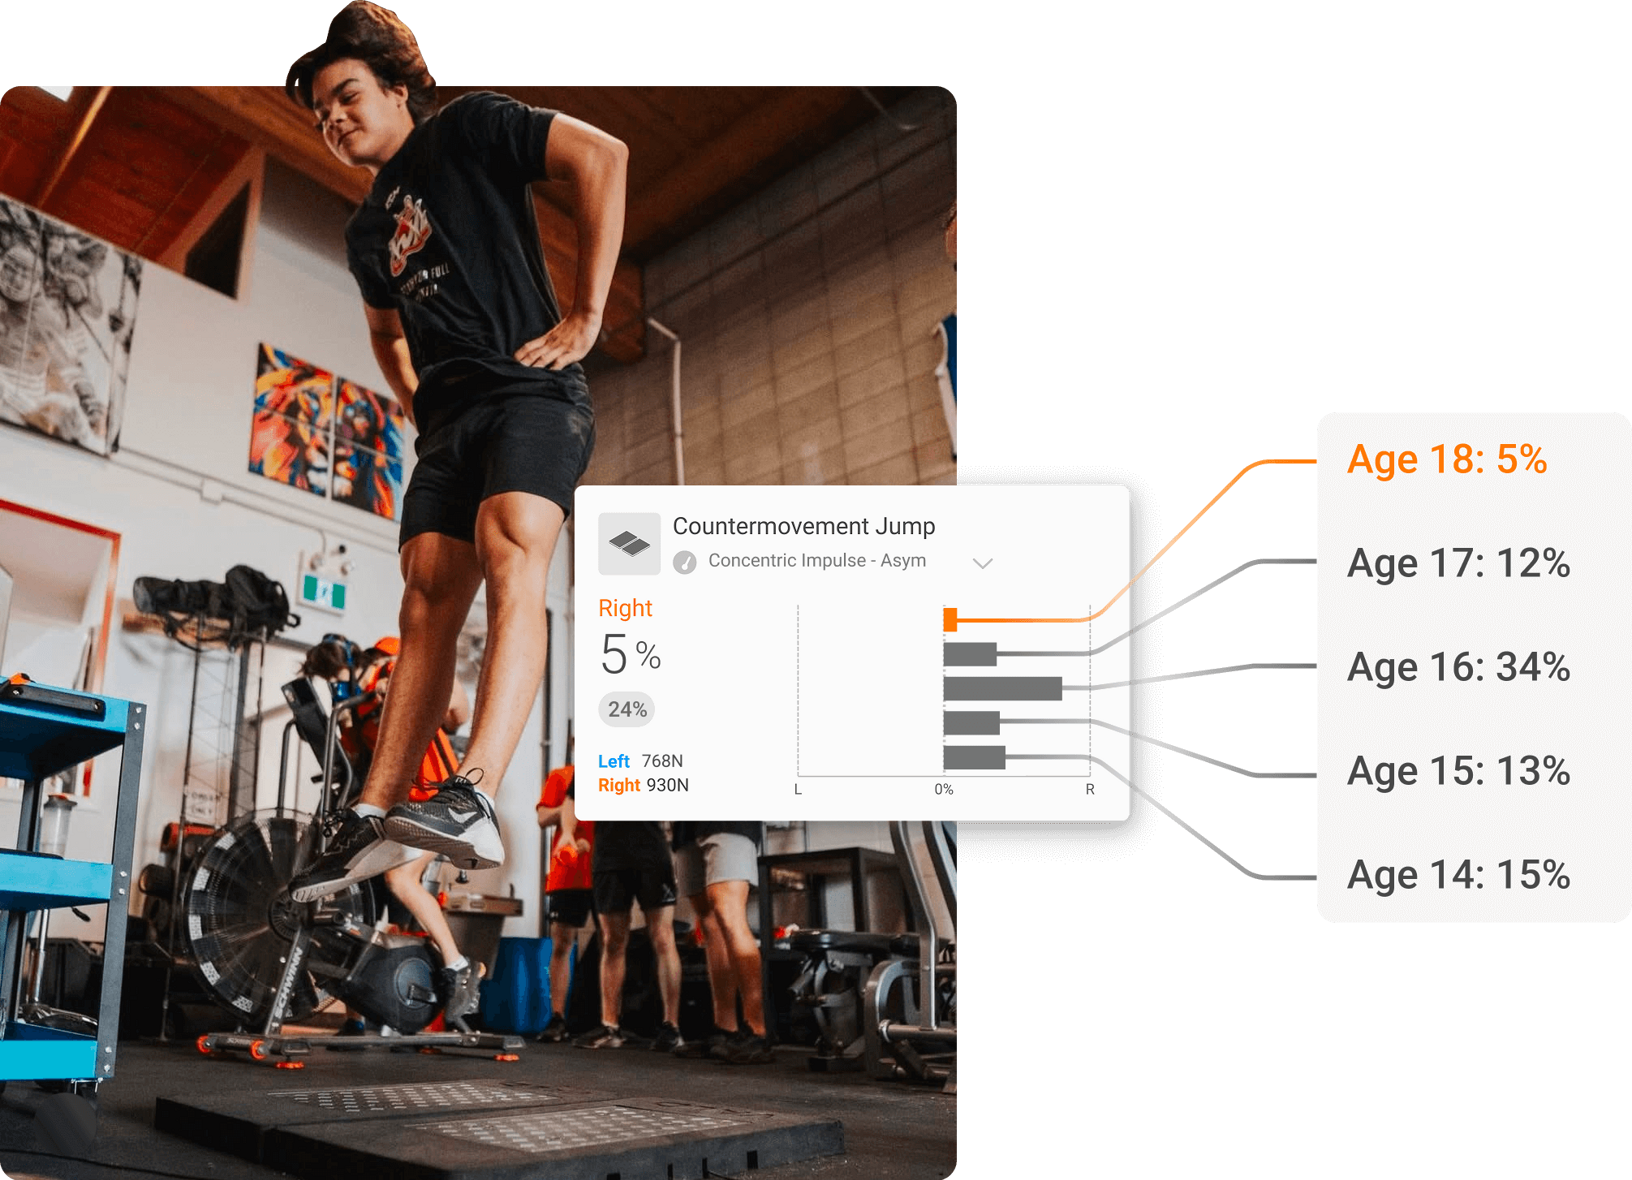
CMJ performed on ForceDecks with results displayed from VALD Hub.
Monitoring health and performance trends through his growth spurt allowed us to focus on LTAD rather than isolated test results. While asymmetry varied, his peak power, jump height and impulse consistently improved year over year, indicating our performance programming was improving his physical outputs. This objective data guided our programming and helped support his continued progress both on and off the ice.
Monitoring health and performance trends through his growth spurt allowed us to focus on LTAD rather than isolated test results.
Across our broader youth population, we have seen average yearly CMJ height increases of 2-5%, with some athletes exceeding 15% during breakout development years. VALD technology has become an essential component of our LTAD approach, offering the insights needed to individualize training and bridge the gap between talent and potential – for youth hockey and beyond.
If you would like to learn more about how to integrate VALD’s human measurement technology into your organization to support youth development, guide individualized training and enable longitudinal data tracking, please reach out here.
References
- Philippaerts, R. M., Vaeyens, R., Janssens, M., Van Renterghem, B., Matthys, D., Craen, R., Bourgois, J., Vrijens, J., Beunen, G., & Malina, R. M. (2006). The relationship between peak height velocity and physical performance in youth soccer players. Journal of Sports Sciences, 24(3), 221–230. https://doi.org/10.1080/02640410500189371