AFL vs NRL: 2023 Jump Performance
Available in:
EN
The Australian Football League (AFL) and the National Rugby League (NRL) are two of the largest football codes in Australia, both with athletes who possess unique physical qualities. The ForceDecks Dual Force Plate System have become more and more common across both sports, with usage increasing significantly year-on-year. Now, all men’s NRL and AFL teams use VALD technology with their athletes. The use of this technology continually aids practitioners to physically profile, monitor, and implement specific change at both an individual athlete and team level.
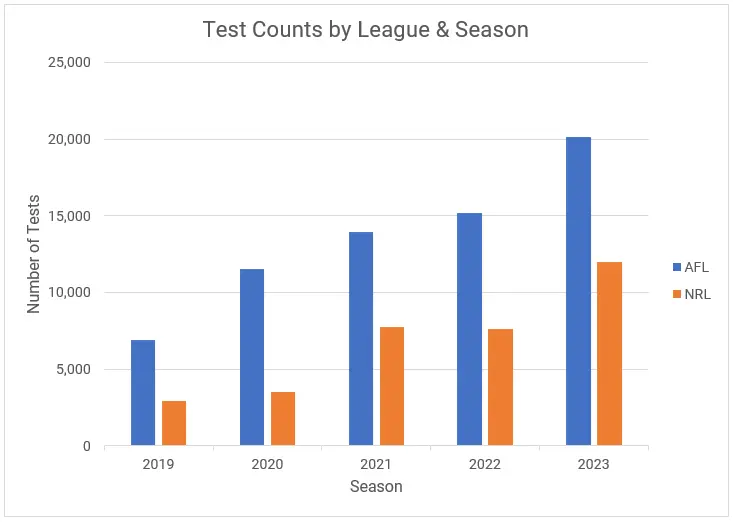
Testing volumes by year
The countermovement jump (CMJ) and drop jump (DJ) tests are the two most common tests across these leagues over the past season. Figure 1 shows the year-on-year increases in usage and testing for these tests across the competitions.
Normative data updates
We have previously published normative data across both the AFL and NRL competitions for both the CMJ and DJ tests, looking at Relative Concentric Peak Power and the Reactive Strength Index (RSI), respectively. This article provides some updated normative data including additional metrics.
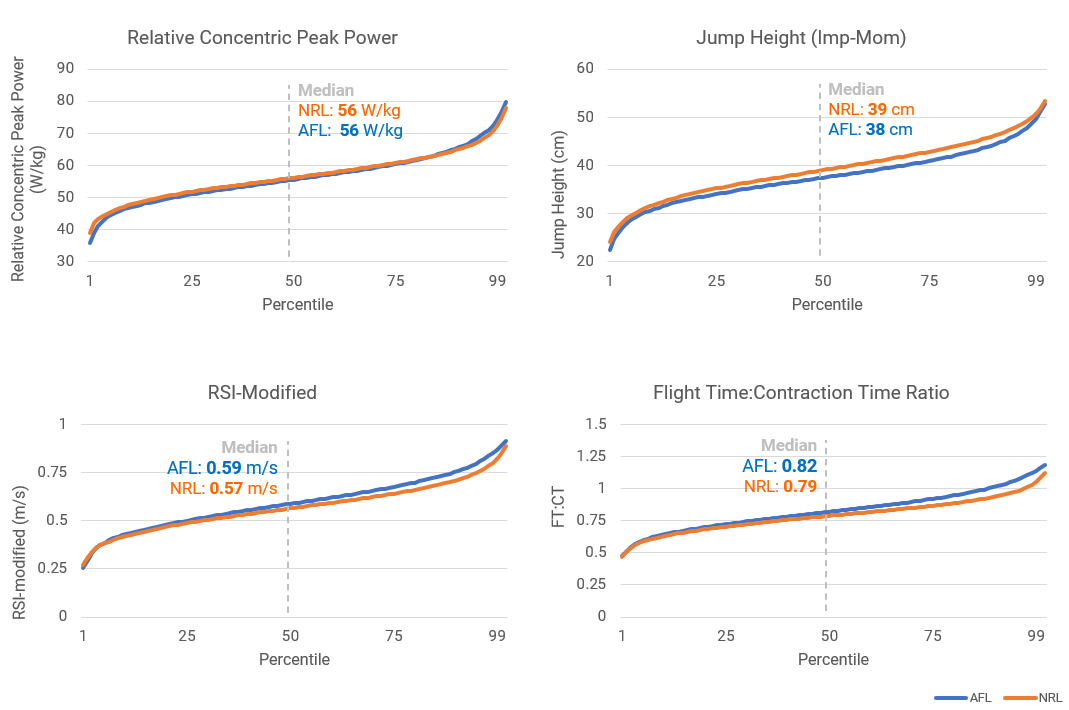
Countermovement jump
Countermovement jump performance remains largely comparable between the two codes, with little differences in the medians of each for relative concentric peak power.
However, for other key metrics there are some clear differences, notably:
- Jump height calculated via the impulse-momentum method tended to trend slightly higher for the cohort of NRL players. This may be due to the ability for an NRL to generate greater absolute peak forces, as there is a relationship between peak power and jump height.
- RSI-Modified and flight time:contraction time (FT:CT) values were slightly higher across the AFL cohort. This could suggest that AFL players – on average – may have greater plyometric or stretch-shortening cycle (SSC) abilities.
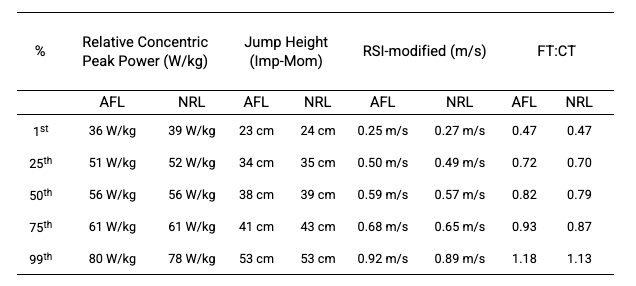
Below are normative data for key metrics across both the AFL and NRL competitions:
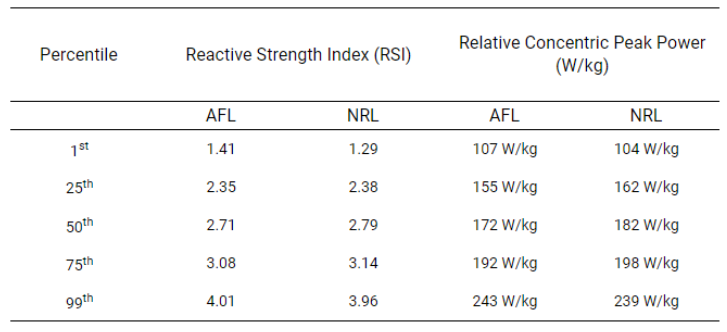
Drop jump
Similar to countermovement jump performance, there are parallels between the cohorts when analysing drop jump performance.
However, the NRL cohort exhibits a higher trend across key metrics including the reactive strength index and relative concentric peak power.
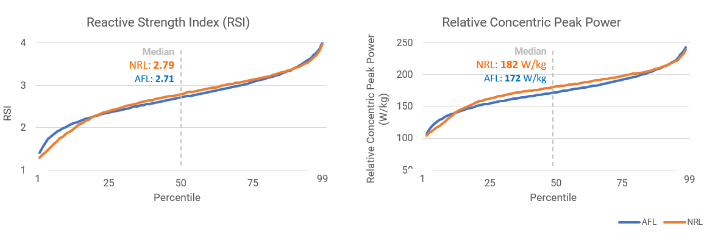
Below are drop jump normative data results for key metrics across both the AFL and NRL competitions:
Observing the significant year-on-year growth in testing volumes with ForceDecks across both professional codes suggests sporting organisations are placing increasing value on the data obtained from objective measurement technology.
The 2023 data analysed in this article has provided some interesting insights into the similarities and differences between the physical performance characteristics of these two cohorts. It is interesting that despite the different demands of the two sports, there were only subtle differences in the jump performance between AFL and NRL athletes.
Unlike a previous analysis between different position groups in American Football players (as highlighted in NFL and NCAA football), the NRL and AFL cohorts show greater similarities in their test scores.
These insights are invaluable for coaches, athletes, and practitioners in tailoring training strategies to the specific demands of each sport and maintaining a competitive edge in the ever-evolving landscape of sports science and technology. The power of data that can be obtained from objective measurement technology will continue to provide even greater insights as more testing is performed across all stages of athletic development – from youth to professional.
If you would like to know more about how to integrate VALD’s human measurement technology into your organisation to help with the engagement of your clients, please reach out here.