Testing Curvilinear Sprints and Decelerations with SmartSpeed Timing Gates
About the Authors
Lucas Galmiche is a client success manager for Continental Europe at VALD and a PhD Candidate in Sports Biomechanics at the German Sport University Cologne. His research investigates how curvilinear deceleration affects knee joint loading, aiming to improve the understanding of non-contact anterior cruciate ligament (ACL) injuries in soccer and to develop practical assessments for performance and health practitioners.
Dr. Morgan Williams is a data scientist at VALD and adjunct associate professor at Griffith University’s School of Health Sciences and Social Work. As part of the VALD Data Science Team, he uncovers new insights into VALD data and identifies how they can be used to enhance practice.
Traditionally, performance testing in team sports has focused almost exclusively on how fast an athlete can sprint over a set distance. Sprint speed and acceleration dominate the conversation, but this narrow lens overlooks a critical component of real-world performance. In the dynamic, high-speed, multi-directional nature of team sports, the ability to brake efficiently is just as vital as explosive acceleration.
It is time to rethink what we measure and why.
Much like the love-hate relationship between sprint speed and hamstring strength, deceleration has both a good and a bad side. Deceleration is critical for athletic performance, yet it simultaneously exposes the joints to high forces, which demand high levels of physical preparation.
Much like the love-hate relationship between sprint speed and hamstring strength, deceleration has both a good and a bad side.
In this blog, we explain why deceleration matters, break down the most practical testing options and show how SmartSpeed timing gates can capture data that truly counts – not just how fast your athletes can move, but also how well they can slow down.
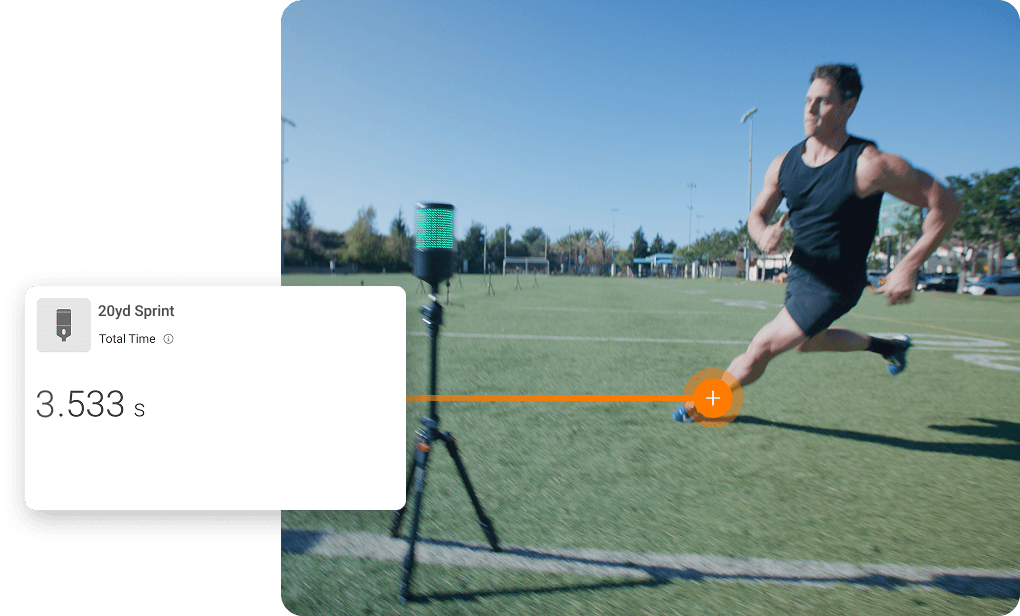
SmartSpeed timing gates measuring an athlete’s curvilinear speed.
Testing the Brakes
In multi-directional team sports, athletes are constantly changing direction – often at high speeds and under pressure. Data shows English Premier League footballers execute around 600 sub-90° direction changes and 100 sharper 90-180° turns in a match (Bloomfield et al., 2007).
Similar findings are observed across a range of team sports, with data suggesting athletes perform more high-intensity decelerations than accelerations in matches (Harper et al., 2019).
Changing direction during movement demands rapid braking to reduce momentum, followed by immediate acceleration in a new direction. These braking actions can generate peak forces of up to six times body weight in less than 50ms (Verheul et al., 2021).
Compared to acceleration or sprinting at top speed, high-intensity deceleration produces greater peak forces and higher loading rates, increasing the risk of soft tissue damage and joint injury…
Compared to acceleration or sprinting at top speed (Bezodis et al., 2008), high-intensity deceleration produces greater peak forces and higher loading rates, increasing the risk of soft tissue damage and joint injury, particularly to the knee and ankle.
When such high-impact efforts are repeated frequently within a short period, the cumulative strain accelerates the onset of fatigue and causes soft tissue damage, which reduces performance in the short term and increases the time needed for long-term recovery.
Ground reaction force (GRF) profiles during horizontal deceleration, acceleration and maximum-velocity sprinting. Illustration produced by Harper et al. (2022), adapted from Verheul et al. (2021) and Bezodis et al. (2008).
Although deceleration places significant physical demands on athletes, it is often not assessed with the same focus as acceleration or maximum speed in team sports.
To support the development of physically resilient athletes and reduce the risk of injury…include deceleration in performance testing.
To support the development of physically resilient athletes and reduce the risk of injury, it is important to include deceleration in performance testing. Identifying effective methods for evaluating this aspect of movement is a necessary next step.
Field-Based Options to Assess Horizontal Deceleration Ability
Three practical testing formats are commonly used to evaluate on-field deceleration ability. These include:
- Sharp change of direction (COD) tests
- Stop at pre-set distance tests
- Start deceleration at pre-set distance tests
Common field-based testing formats used to assess deceleration ability.
All three test formats provide useful information. However, they share a common limitation: they assess deceleration in a linear format but do not replicate the movements and deceleration forces experienced in sport.
Athletes Do Not Run Like Robots
From tracking technology, we know that approximately 85% of maximum velocity efforts completed by professional soccer players are curvilinear sprints (Caldbeck & Dos’Santos, 2022). This raises another important question related to standard fitness testing: if most high-speed actions happen in curves, why do we still focus so heavily on straight-line sprint testing to inform practice?
…if most high-speed actions happen in curves, why do we still focus so heavily on straight-line sprint testing to inform practice?
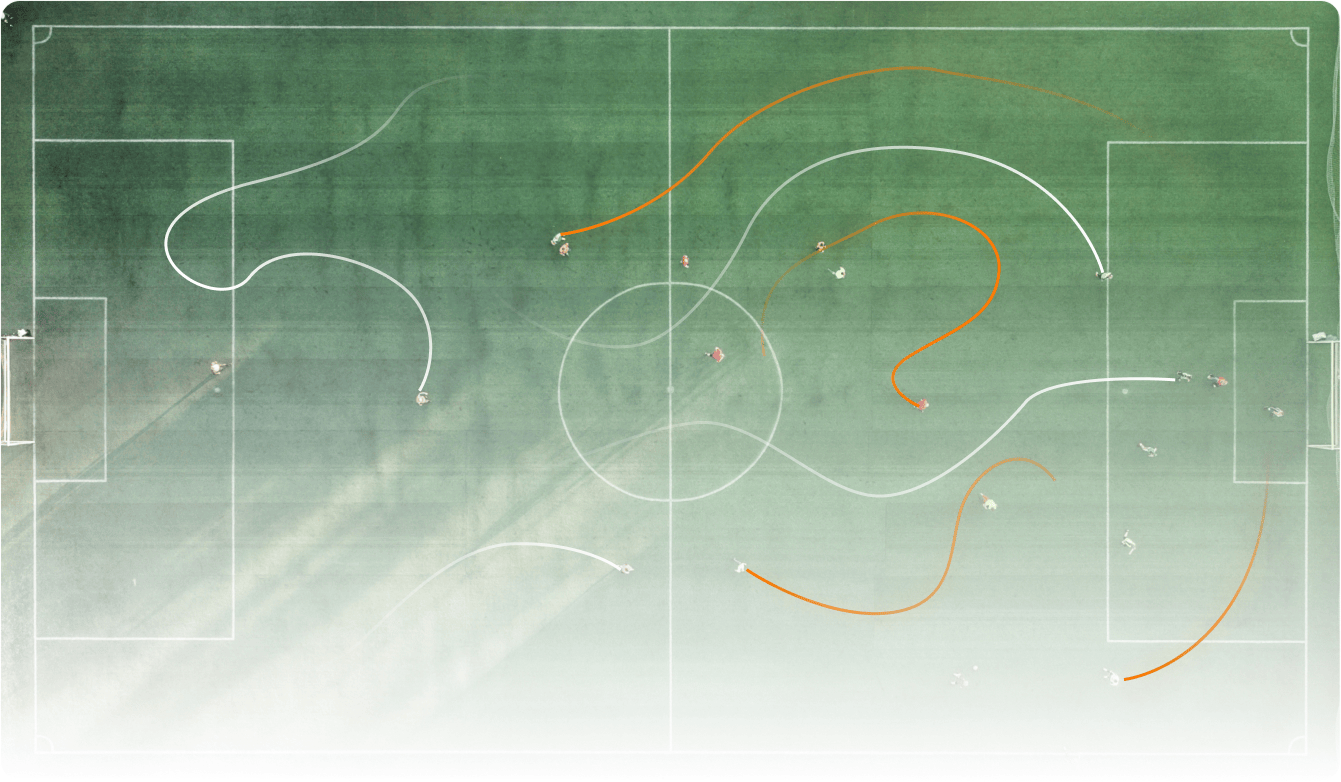
Over 20 years ago, athlete tracking reports revealed that soccer movements are not all in straight lines.
To address this gap in testing, a novel 17m curved sprint test has been developed using the penalty arc of a standard FIFA soccer pitch (Fílter et al., 2020a, 2020b). This simple yet effective test requires only two timing gates and can be performed in both clockwise and counterclockwise directions to identify potential asymmetries.
Setup for the 17m soccer-specific “curved sprint” test.
Including a curved sprint test is justified because running curves involves different physical qualities than linear sprints. This is supported by a moderate correlation (r = 0.6) between straight-line and curved sprint performance (Fílter et al., 2020a), indicating that being fast in a straight line is not the same as being fast on curves.
…[if athletes do not] sprint in straight lines, they likely do not decelerate in straight lines either.
In addition, since athletes rarely sprint in straight lines, they likely do not decelerate in straight lines either. Therefore, testing should capture information about curved deceleration.
Curved Deceleration: A Hidden Load on the ACL?
Curved decelerations often result in greater knee valgus compared to linear stops, due to increased external knee abduction moments (KAM). This occurs as the GRF shifts laterally, lengthening the frontal plane moment arm and placing more stress on the joint than in linear movements where the GRF aligns more closely with the tibia.
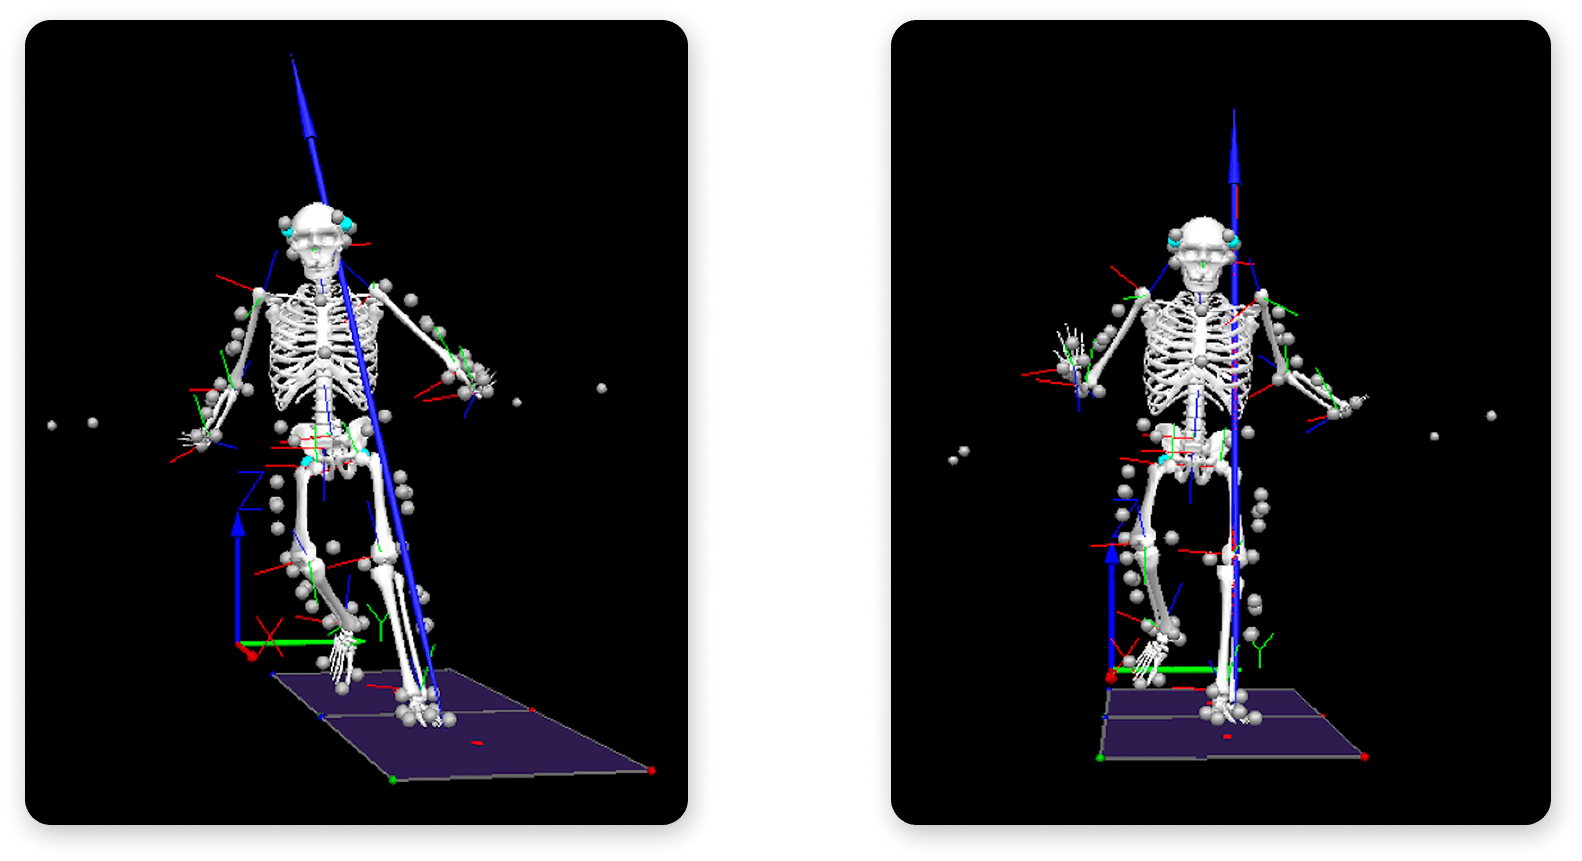
Knee abduction moment is greater during curved deceleration due to the GRF vector not aligning with the knee joint center, which increases the moment arm.
Elevated KAM is a recognized risk factor for ACL injury, particularly in reactive, unanticipated movements (McLean et al., 2004). During high-speed curved decelerations, the knee joint faces both sagittal and frontal plane stresses, often occurring when the foot is poorly aligned or compromises stability due to inefficient placement.
This may explain why most non-contact ACL injuries in soccer happen during high-speed defensive actions like pressing (Della Villa et al., 2020; Lucarno et al., 2021; Della Villa et al., 2025).
…to truly reflect the demands of match play…field-based assessments [should] capture how athletes decelerate during curved movements.
Therefore, to truly reflect the demands of match play, we need field-based assessments that capture how athletes decelerate during curved movements.
Curved Sprint-to-Stop: Calculating the Curved Sprint Deceleration Deficit
Recognizing the importance of braking in curved movements, Dr. Alberto Fílter has proposed modifying his curved sprint test by adding a deceleration component. In this variation, athletes sprint 17m along the arc of the penalty box and are required to come to a complete stop within a 1m x 1m box placed at the end of the curve.
Using SmartSpeed, the time difference between trials with and without the stop is used to calculate a curved sprint deceleration deficit (CSD deficit):

CSD deficit provides a practical snapshot of curved braking efficiency.
CSD deficit provides a practical snapshot of curved braking efficiency. Athletes with better braking capacity can delay deceleration and stop more abruptly, while those with limited braking ability slow down early and lose time, resulting in a higher CSD deficit.
Curve sprint and CSD deficit setups, adapted from Fílter’s Curved Sprinting 101 blog (2024).
Courtesy of Dr. Alberto Fílter, preliminary benchmarks from elite soccer data indicate that a CSD deficit of 10-20% is good, 20-25% is normal and greater than 25% reflects poor deceleration capacity in curves, providing a useful baseline for profiling curved deceleration ability and guiding training priorities.
Curved Acceleration-Deceleration Ability Test: Estimating Average Deceleration
Building on the sprint-to-stop approach, the curved acceleration-deceleration ability (ADA) test provides a complementary perspective on braking performance by estimating average deceleration – a metric that indicates how efficiently an athlete can dissipate momentum along a curved path.
…the curved ADA test provides a complementary perspective on braking performance…[it] indicates how efficiently an athlete can dissipate momentum along a curved path.
In this variation, athletes sprint 17m along the penalty arc, then decelerate to a full stop as quickly as possible. Approach velocity is captured using SmartSpeed timing gates placed 1m apart at the 16m line (1m/1m sprint time), and stopping distance is measured with a tape measure from the final timing gate to the heel of the athlete’s shoe.
From there, average deceleration can be estimated using:
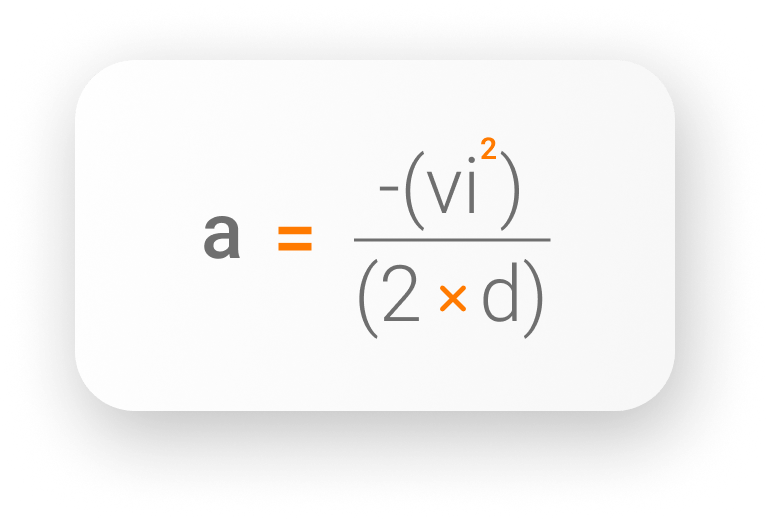
Where: a = average deceleration (m/s2); vi = athlete’s approach velocity (m/s); d = stopping distance (m)
This method provides an easy way to use timing gates to objectively quantify how efficiently an athlete brakes and controls momentum in curved conditions.
Curved ADA test along the FIFA penalty arc using three timing gates and a measuring tape.
Example: For an athlete approaching at 5.7m/s, and stopping over 3.9m:
a = –(vi²) / (2 x d)
= –5.72 / (2 x 3.9)
= –4.17m/s2
Note: Early braking can skew deceleration results. To ensure valid data, exclude trials where approach velocity (vi) is more than 10% below maximum effort.
Incorporating approach velocity and stopping distance, in the style of the Quadrant of Boom, we can begin to piece together the complex puzzle of performance and injury risk to prepare athletes better.
The curved ADA test and CSD deficit method provide a field-ready framework to assess curved deceleration from both a performance and risk management perspective – helping practitioners bridge the gap between how athletes move in testing and how they brake in real games.
Takeaways
- Horizontal deceleration is a vital, yet often under-tested component of athletic performance.
- Team-sport athletes rarely move in straight lines. Integrating curvilinear sprint and deceleration assessments using SmartSpeed timing gates can provide a more sport-specific understanding of an athlete’s capabilities.
- Curved deceleration may place unique mechanical loads on the knee, particularly the ACL, highlighting a growing need to assess and train this quality.
If you would like to learn more about how to enhance your practice using SmartSpeed timing gates or need advice on integrating them into your teaching, please get in touch. We are here to help!
References
- Bloomfield, J., Polman, R., & O'Donoghue, P. (2007). Physical demands of different positions in FA Premier League soccer. Journal of Sports Science and Medicine, 6(1), 63–70. https://pubmed.ncbi.nlm.nih.gov/24149226/
- Harper, D. J., Carling, C., & Kiely, J. (2019). High-intensity acceleration and deceleration demands in elite team sports competitive match play: A systematic review and meta-analysis of observational studies. Sports Medicine, 49(12), 1923–1947. https://doi.org/10.1007/s40279-019-01170-1
- Verheul, J., Nedergaard, N. J., Pogson, M., Lisboa, P., Gregson, W., Vanrenterghem, J., & Robinson, M. A. (2021). Biomechanical loading during running: Can a two mass-spring-damper model be used to evaluate ground reaction forces for high-intensity tasks? Sports Biomechanics, 20(5), 571–582. https://doi.org/10.1080/14763141.2019.1584238
- Bezodis, I. N., Kerwin, D. G., & Salo, A. I. (2008). Lower-limb mechanics during the support phase of maximum-velocity sprint running. Medicine and Science in Sports and Exercise, 40(4), 707–715. https://doi.org/10.1249/MSS.0b013e318162d162
- Harper, D. J., McBurnie, A. J., Santos, T. D., Eriksrud, O., Evans, M., Cohen, D. D., Rhodes, D., Carling, C., & Kiely, J. (2022). Biomechanical and neuromuscular performance requirements of horizontal deceleration: A review with implications for random intermittent multi-directional sports. Sports Medicine, 52(10), 2321–2354. https://doi.org/10.1007/s40279-022-01693-0
- Caldbeck, P., & Dos'Santos, T. (2022). A classification of specific movement skills and patterns during sprinting in English Premier League soccer. PloS one, 17(11), e0277326. https://doi.org/10.1371/journal.pone.0277326
- Fílter, A., Olivares, J., Santalla, A., Nakamura, F. Y., Loturco, I., & Requena, B. (2020a). New curve sprint test for soccer players: Reliability and relationship with linear sprint. Journal of Sports Sciences, 38(11-12), 1320–1325. https://doi.org/10.1080/02640414.2019.1677391
- Fílter, A., Olivares-Jabalera, J., Santalla, A., Morente-Sánchez, J., Robles-Rodríguez, J., Requena, B., & Loturco, I. (2020b). Curve sprinting in soccer: Kinematic and neuromuscular analysis. International Journal of Sports Medicine, 41(11), 744–750. https://doi.org/10.1055/a-1144-3175
- McLean, S. G., Lipfert, S. W., & van den Bogert, A. J. (2004). Effect of gender and defensive opponent on the biomechanics of sidestep cutting. Medicine and Science in Sports and Exercise, 36(6), 1008–1016. https://doi.org/10.1249/01.mss.0000128180.51443.83
- Della Villa, F., Buckthorpe, M., Grassi, A., Nabiuzzi, A., Tosarelli, F., Zaffagnini, S., & Della Villa, S. (2020). Systematic video analysis of ACL injuries in professional male football (soccer): Injury mechanisms, situational patterns and biomechanics study on 134 consecutive cases. British Journal of Sports Medicine, 54(23), 1423–1432. https://doi.org/10.1136/bjsports-2019-101247
- Lucarno, S., Zago, M., Buckthorpe, M., Grassi, A., Tosarelli, F., Smith, R., & Della Villa, F. (2021). Systematic video analysis of anterior cruciate ligament injuries in professional female soccer players. The American Journal of Sports Medicine, 49(7), 1794–1802. https://doi.org/10.1177/03635465211008169
- Della Villa, F., Stride, M., Bortolami, A., Williams, A., Davison, M., & Buckthorpe, M. (2025). Systematic video analysis of ACL injuries in male professional english soccer players: A study of 124 cases. Orthopaedic Journal of Sports Medicine, 13(2), 23259671251314642. https://doi.org/10.1177/23259671251314642
- Fílter, A. (2024, February 9). Curved sprinting 101. Science of Multi-Directional Speed. https://sciofmultispeed.com/curved-sprinting-101/