Profiling the HYROX Athlete: What actually matters
Available in:
EN
About the Author
Dr. Chris Bramah is a consultant physiotherapist and researcher who specializes in applying biomechanics and sports science to injury assessment, rehabilitation and return-to-sport decision-making.
With over 15 years of experience working with Olympic track and field athletes, he also consults across a range of sports, including national sporting organizations and Premier League football clubs. Chris is an active researcher, with publications on biomechanics, athletic performance and injury profiling.
The Unique Demands of HYROX
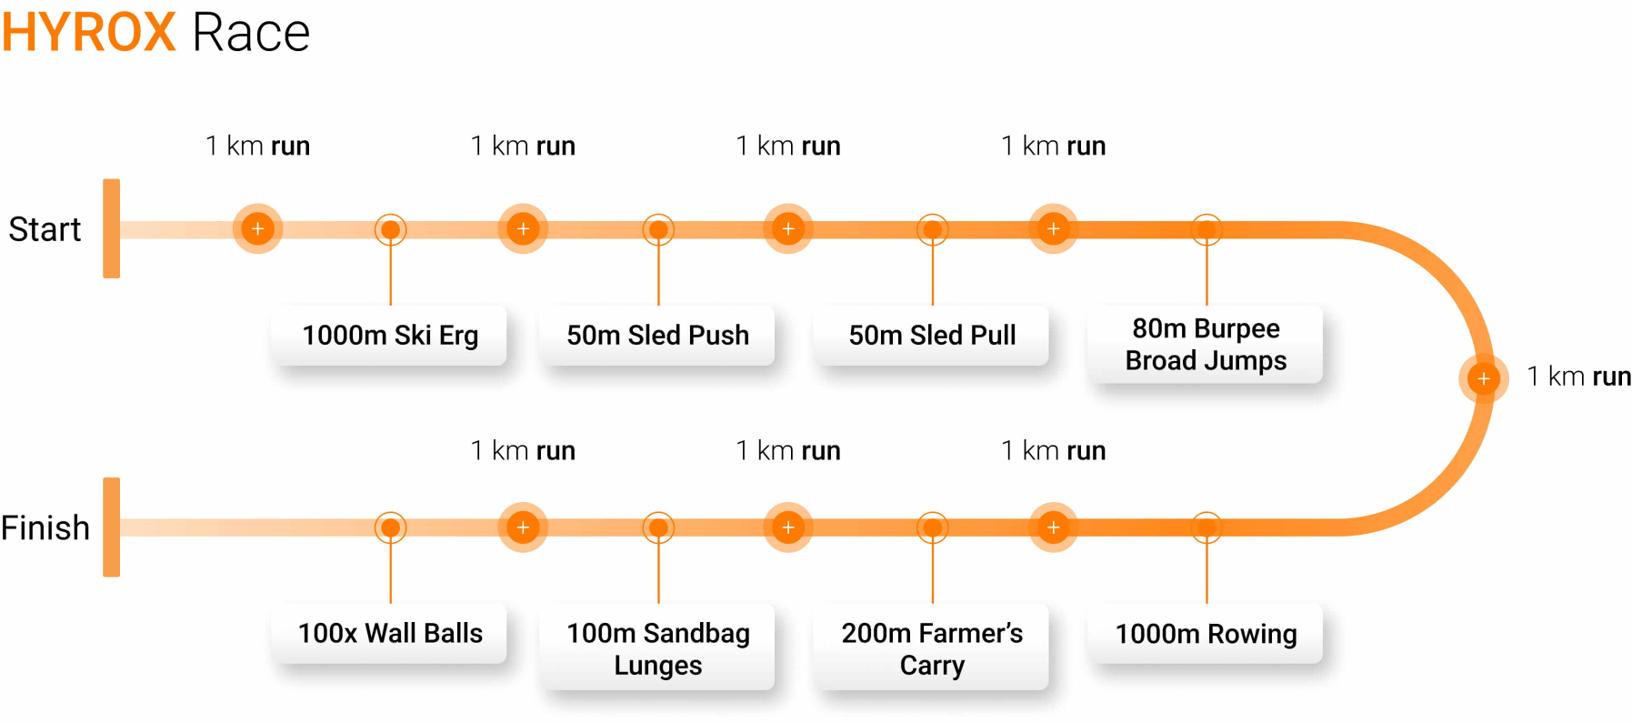
HYROX is a multi-modal fitness race that combines running, maximal strength and strength endurance, making performance profiling challenging.
Practitioners are often unsure which qualities to prioritize and which truly separate podium contenders from the broader field. Despite the variety of demands, several key physical qualities remain consistent across the event and can be reliably assessed. This helps explain why some athletes sustain performance late in the race while others fade.
Despite the variety of demands, several key physical qualities…[help] explain why some athletes sustain performance late in the race while others fade.
Although individual station performance matters, race data consistently show that sustained running is the primary determinant of overall outcomes. Data from the top 50 HYROX athletes indicate that running accounts for 30-40% of the time separating the top 15 finishers (Brandt et al., 2025).
This separation becomes most pronounced in the later stages of the race, where athletes who maintain their running speed remain competitive, while others progressively fall back.
HYROX athlete training for competition, with running as a key determinant of performance and profiling.
Objective profiling of performance capacities therefore requires tools capable of capturing force-time characteristics, reactive strength and mechanical efficiency under repeatable conditions. Systems such as ForceDecks allow practitioners to quantify the neuromuscular and biomechanical traits that underpin sustained running performance.
As a result, profiling station-specific strength alone is unlikely to provide the greatest impact. Instead, profiling should focus on a more fundamental question: how efficiently can an athlete sustain repeated one-kilometer running efforts while operating close to their physiological ceiling?
Why Running Economy Matters
Running economy refers to the energetic cost required to sustain a given running speed. In simple terms, it reflects how much effort an athlete must expend to maintain running pace. While many athletes assume running economy has a direct relationship with aerobic fitness, it actually involves a combination of metabolic, neuromuscular, cardiorespiratory and biomechanical qualities that all influence running performance.
…[running economy] involves a combination of metabolic, neuromuscular, cardiorespiratory and biomechanical qualities that all influence running performance.
HYROX athletes often have similar levels of cardiorespiratory and metabolic fitness, as exercise volumes, intensities and variation are similar among high-level athletes. Therefore, neuromuscular and biomechanical qualities are likely to underpin performance capacity in HYROX athletes. Some of these qualities include:
- Lower-extremity mechanical power
- Leg stiffness (Liu et al., 2022)
- Reactive strength
- Plantar flexion peak force capacity
HYROX athletes often have similar levels of [fitness]… Therefore, neuromuscular and biomechanical qualities are likely to underpin performance…
Athletes with superior running economy will be able to sustain pace with a lower relative energy cost, recover more effectively between efforts and maintain composure late in the race. Key determinants of running economy often involve the storage and return of elastic energy through tendon structures, particularly around the ankle.
In HYROX, running is repeatedly interspersed with high-load strength and endurance tasks. Therefore, unique qualities of running performance (e.g., plantar flexion peak force and reactive strength) often decline with fatigue (Willer et al., 2021).
This is where force-based assessment becomes particularly valuable. Using ForceDecks, practitioners can move beyond simple outcome measures such as pace or split times and begin to profile the physical qualities that underpin running economy.
By identifying athlete-specific limitations in force production or reactive strength, training interventions can be more appropriately targeted – often through relatively simple additions to existing programs.
The Importance of Plantar Flexor Force Capacity
One of the most consistent physical limitations seen in HYROX athletes is reduced plantar flexor force capacity. These structures play a central role in:
- Propulsion during running (Hamner & Delp, 2013)
- Maximizing step length
- Elastic energy storage and return (Lai et al., 2014)
- Reducing the metabolic cost of running (Arampatzis et al., 2006)
Collectively, the plantar flexors play a critical role in running economy, particularly when running must be repeated under fatigue.
Collectively, the plantar flexors play a critical role in running economy, particularly when running must be repeated under fatigue. Despite this, many athletes – including high-level competitors – demonstrate clear deficits in ankle performance measures.

Profiling with the Kneeling Isometric Plantar Flexion Test
Isometric plantar flexion testing, performed in a kneeling position, provides a simple and reliable way to assess absolute force output, force relative to body mass and side-to-side differences. The kneeling isometric plantar flexion test (KIPFT) also offers a self-normalizing setup option, as the athlete’s anthropometrics determine both knee flexion angle and setup position.

Tags can be created and applied to the seated calf raise assessment to indicate when it is used for the KIPFT, supporting more accurate comparisons between athletes and tests.
How to perform the KIPFT:
- Setup and Equipment: Use a force plate system (e.g., ForceDecks) with a fixed bar or isometric rig. Lock the tested limb firmly between the plate and bar using hard spacers to eliminate padding compression and joint movement.
- Position: Kneel with the non-tested leg behind and torso upright. Place the tested foot on the plate, position the thigh horizontally and angle the shin diagonally to achieve ~20° of ankle dorsiflexion. Cross the arms and keep the trunk upright to limit extraneous movement.
- Execution: Perform two submaximal repetitions, then complete three maximal efforts per limb, pushing “fast and hard” into the bar for 3-5 seconds, with 30-60 seconds of rest between trials.
- Key Constraints: Test unilaterally in socks, zero the plate between athletes and maintain consistent joint angles to support reliable peak force measurement.
Interpreting the Results
When compared against elite endurance runners, HYROX athletes demonstrate clear deficits:
- Elite Running Athletes: 19.5-21.5N/kg (1.9-2.2 × body weight)
- Elite HYROX Athletes: 18N/kg (1.8 × body weight)
When plantar flexor force capacity is limited, running economy is likely to suffer (Arampatzis et al., 2006; Lai et al., 2014).
In this context, simply increasing conditioning or aerobic training is unlikely to resolve the performance issue. Instead, targeted development of plantar flexor force capacity becomes a key area for improving running resilience and maintaining pace as fatigue accumulates across the race.
…targeted development of plantar flexor force capacity [is key] for improving running resilience…as fatigue accumulates across the race.
Reactive Strength and Force Recycling
Efficient running depends on how quickly force can be absorbed and re-applied, not just how much is produced. Lower-limb reactive strength therefore plays a key role in sustaining performance during HYROX, influencing ground contact time (GCT) and overall energetic cost (Willer et al., 2021).
Reactive strength reflects the ability to rapidly transition from eccentric to concentric performance capabilities through the stretch-shortening cycle (SSC). The countermovement rebound jump (CMRJ) provides a practical way to assess this quality relative to maximal ballistic capacity, rather than relying solely on fixed drop-jump protocols.
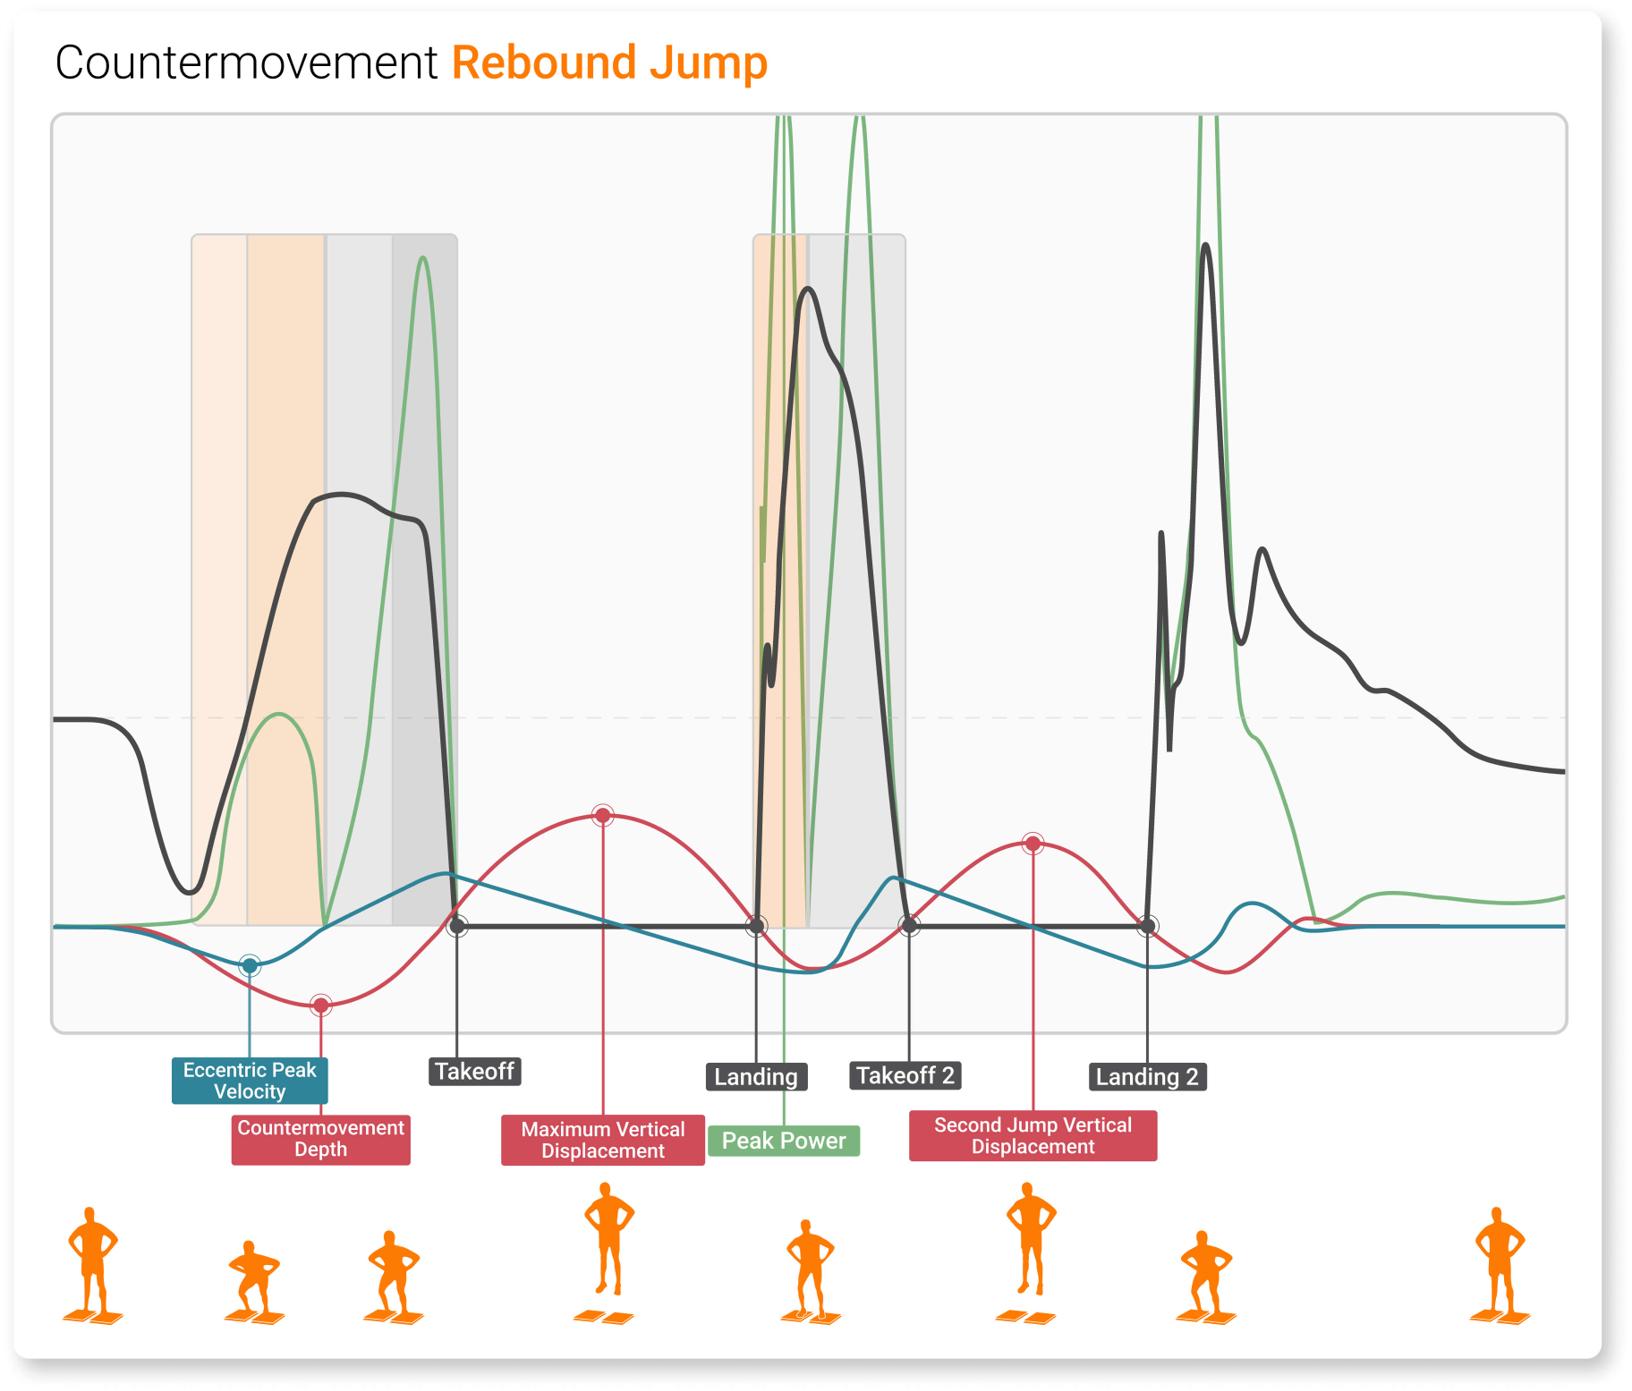
The CMRJ visualized with overlaid force, power, displacement and velocity-time curves, with key landmarks identified.
Analyzing a rebound jump relative to an athlete’s countermovement jump (CMJ) height provides a relative comparison of reactive strength to ballistic strength. Metrics like GCT and reactive strength index (RSI) help identify how effectively force is returned during fast SSC activities, such as running.
…GCT and RSI help identify how effectively force is returned during fast SSC activities, such as running.
Consistency is also an important metric to track. Results that vary significantly may be less trustworthy for practitioners monitoring change over time. By monitoring metric consistency (e.g., the coefficient of variation), practitioners can set thresholds (e.g., within 5% variance) to ensure athlete performance is consistent and repeatable – improving confidence in change-detection methods.
The table below outlines key metrics and their rationale for an elite HYROX athlete who was recently tested:
| Metric | Value | Rationale |
| Initial Jump Height (% of Best CMJ) | 98% | This reflects intent applied on the first jump, indicating whether the athlete reduces their jump height to better manage impact and rebound forces. |
| Initial Jump Height | 26.5cm | This indicates ballistic strength capacity and determines rebound drop height, which is useful for contextualizing rebound performance. |
| RSI | 2.4 | This reflects elastic strength capacity and helps track performance qualities over time. |
| Contact Time | 197ms | This should be interpreted alongside RSI and rebound height. A short contact time with preserved height usually shows efficient force recycling, while a short contact time with reduced height may suggest a stiff strategy without effective impulse. |
| Rebound Jump Height | 27cm | This shows how an athlete’s reactive strategy transfers into output. If rebound height drops significantly despite a strong initial height, it may indicate poor elastic utilization. |
Why Traditional HYROX Training Leaves Gaps
HYROX training commonly emphasizes moderate loads, high repetitions and metabolic stress. This approach is highly effective at preparing athletes to tolerate the demands of competition and perform the event-specific tasks. However, it often fails to provide a sufficient mechanical stimulus to meaningfully improve tendon stiffness and elastic properties that are beneficial to running economy.
HYROX training…often fails to…meaningfully improve tendon stiffness and elastic properties that are beneficial to running economy.
Research consistently shows that positive tendon adaptations are driven primarily by high-strain mechanical loading (Bohm et al., 2015). Therefore, training approaches that expose tendons to sustained, high-strain loading – such as heavy resistance or isometric loading – consistently produce the greatest adaptations. As a result, the training demands for HYROX may not optimize physical qualities that underpin efficient running.
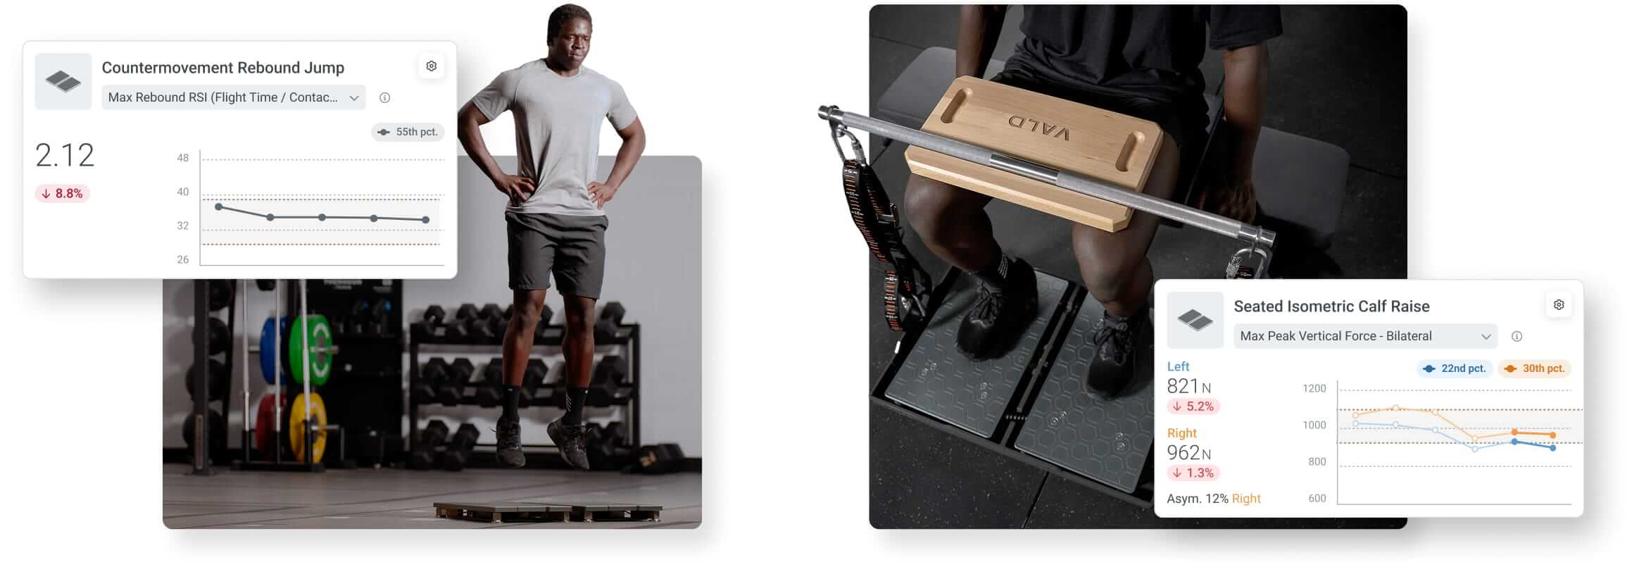
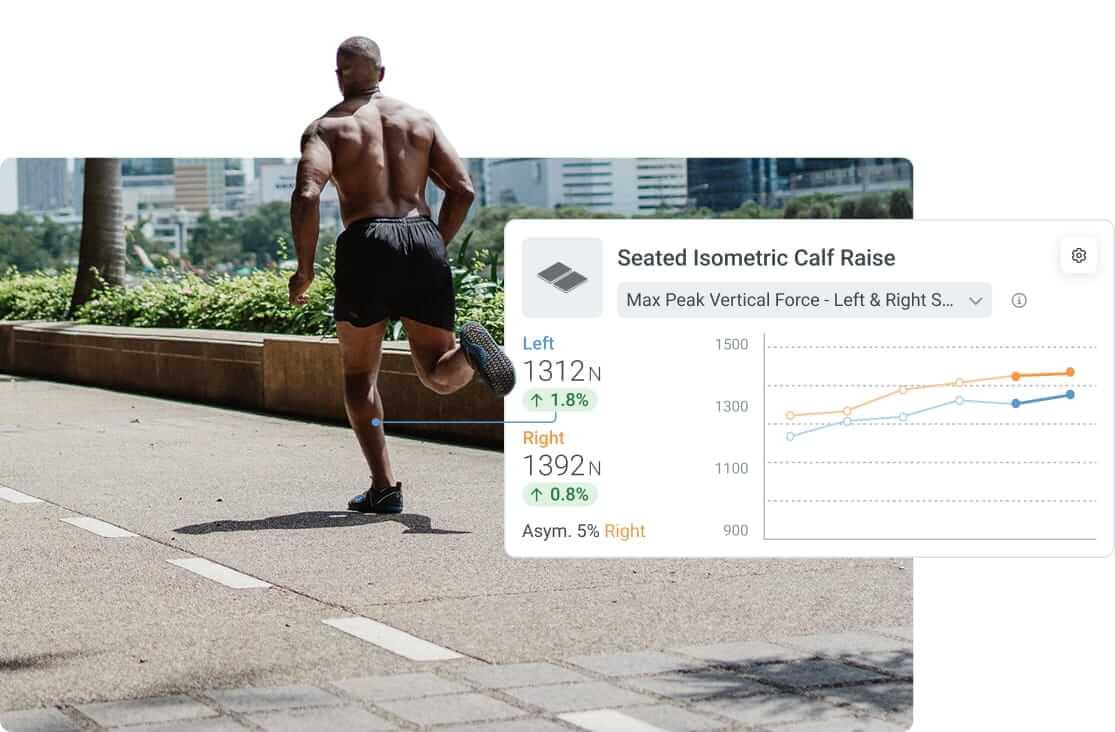
Performance metrics from a comprehensive lower-leg assessment of a HYROX athlete.
Objective testing with ForceDecks allows these gaps to be identified clearly. Rather than assuming that event exposure alone is sufficient, practitioners can identify whether plantar flexor force capacity or reactive strength qualities are underdeveloped relative to an athlete’s conditioning.
Once identified, relatively small and targeted interventions – often added alongside existing HYROX training – can provide a conditioning stimulus, improving physical qualities that influence running efficiency without requiring a complete overhaul of the program.
Final Thoughts
HYROX may appear complex, but the principles underpinning performance are familiar. Athletes who perform best are not simply fitter or tougher – they are more efficient and resilient, able to maintain movement quality and running performance for longer.
By using objective data to understand how force is produced, absorbed and recycled, practitioners can move beyond guesswork and focus on the physical qualities that genuinely support performance across the race. Profiling plantar flexor force capacity, stiffness and reactive strength provides a clearer pathway for targeted interventions – without the need to overhaul existing training programs.
For more insights from Dr. Chris Bramah on preparing and profiling HYROX athletes, listen to his interview on VALDCAST.
If you would like to learn more about the latest ForceDecks testing options and how you can enhance performance and rehabilitation decisions, get in touch with our team.
References
- Arampatzis, A., De Monte, G., Karamanidis, K., Morey-Klapsing, G., Stafilidis, S., & Brüggemann, G. P. (2006). Influence of the muscle-tendon unit's mechanical and morphological properties on running economy. The Journal of Experimental Biology, 209(17), 3345–3357. https://doi.org/10.1242/jeb.02340
- Bohm, S., Mersmann, F., & Arampatzis, A. (2015). Human tendon adaptation in response to mechanical loading: A systematic review and meta-analysis of exercise intervention studies on healthy adults. Sports Medicine, 1(1), 7. https://doi.org/10.1186/s40798-015-0009-9
- Brandt, T., Ebel, C., Lebahn, C., & Schmidt, A. (2025). Acute physiological responses and performance determinants in Hyrox© – a new running-focused high intensity functional fitness trend. Frontiers in Physiology, 16, 1519240. https://doi.org/10.3389/fphys.2025.1519240
- Hamner, S. R., & Delp, S. L. (2013). Muscle contributions to fore-aft and vertical body mass center accelerations over a range of running speeds. Journal of Biomechanics, 46(4), 780–787. https://doi.org/10.1016/j.jbiomech.2012.11.024
- Lai, A., Schache, A. G., Lin, Y. C., & Pandy, M. G. (2014). Tendon elastic strain energy in the human ankle plantar-flexors and its role with increased running speed. The Journal of Experimental Biology, 217(17), 3159–3168. https://doi.org/10.1242/jeb.100826
- Liu, B., Wu, J., Shi, Q., Hao, F., Xiao, W., Yu, J., Yu, F., & Ren, Z. (2022). Running economy and lower extremity stiffness in endurance runners: A systematic review and meta-analysis. Frontiers in Physiology, 13, 1059221. https://doi.org/10.3389/fphys.2022.1059221
- Willer, J., Allen, S. J., Burden, R. J., & Folland, J. P. (2021). Neuromechanics of Middle-Distance Running Fatigue: A Key Role of the Plantarflexors? Medicine and Science in Sports and Exercise, 53(10), 2119–2130. https://doi.org/10.1249/MSS.0000000000002695