Not All Norms Are Created Equal
Over the past decade, demand for objective performance testing has grown, improving training standards and outcomes through more informed assessment and decision-making. However, tests alone have limitations in their application.
Test results and performance data often appear arbitrary in the absence of a reference standard or benchmark against which they are compared. Normative data provide the context needed to categorize an individual's performance relative to age- and gender-matched peers.
Normative data provides the context for categorizing an individual's performance in relation to that of age- and gender-matched peers.
Defining normative data
Normative data Normative data refers to reference values derived from a defined population that help practitioners understand how performance on a given test typically varies within that group. For example, normative data can be used to classify or categorize performance in tests such as a counter-movement jump (CMJ)It's a tool that helps practitioners better understand performance status and sport-specific ability in a population of athletes.
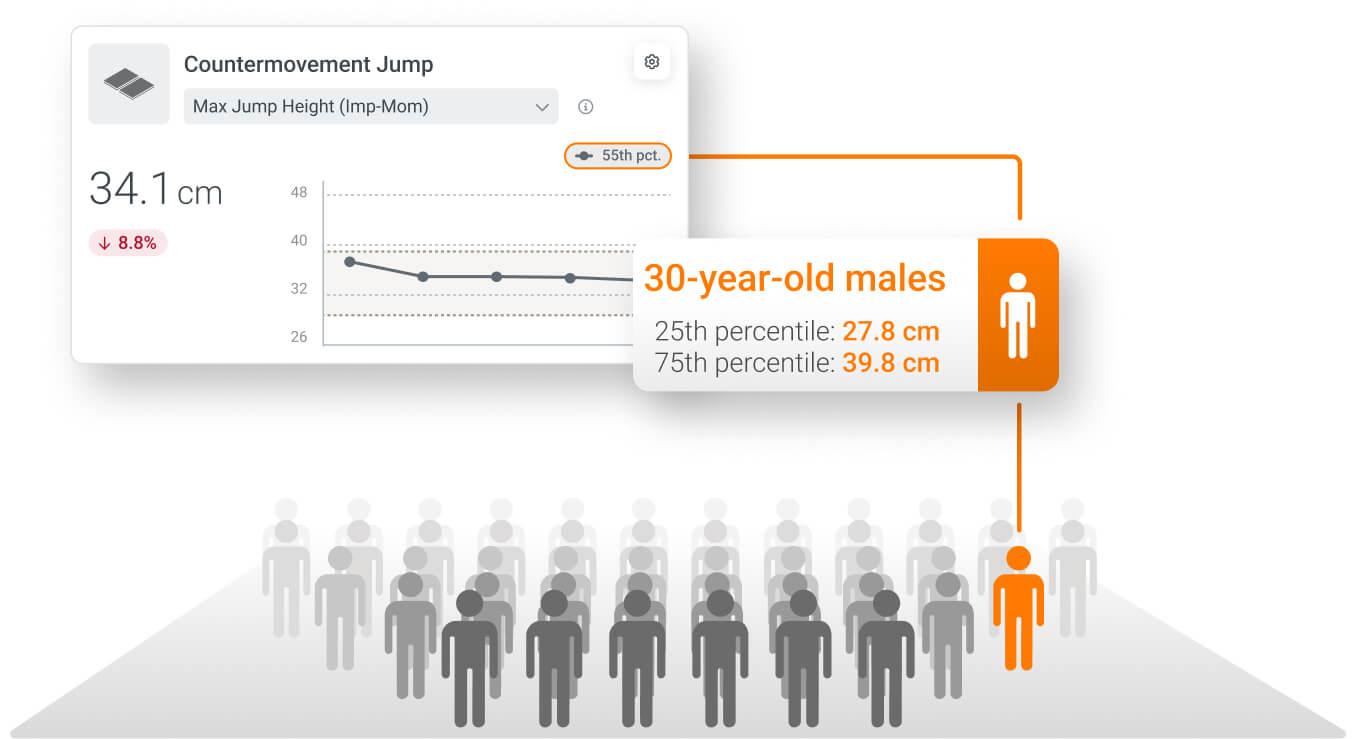
These benchmarks are usually derived from large data sets and are used to describe the performance of members of a population in relation to their peers. Individual performance data are most often classified by percentile (1st-100th), providing a practical frame of reference for interpreting whether a result is low, typical or high for the population in question.
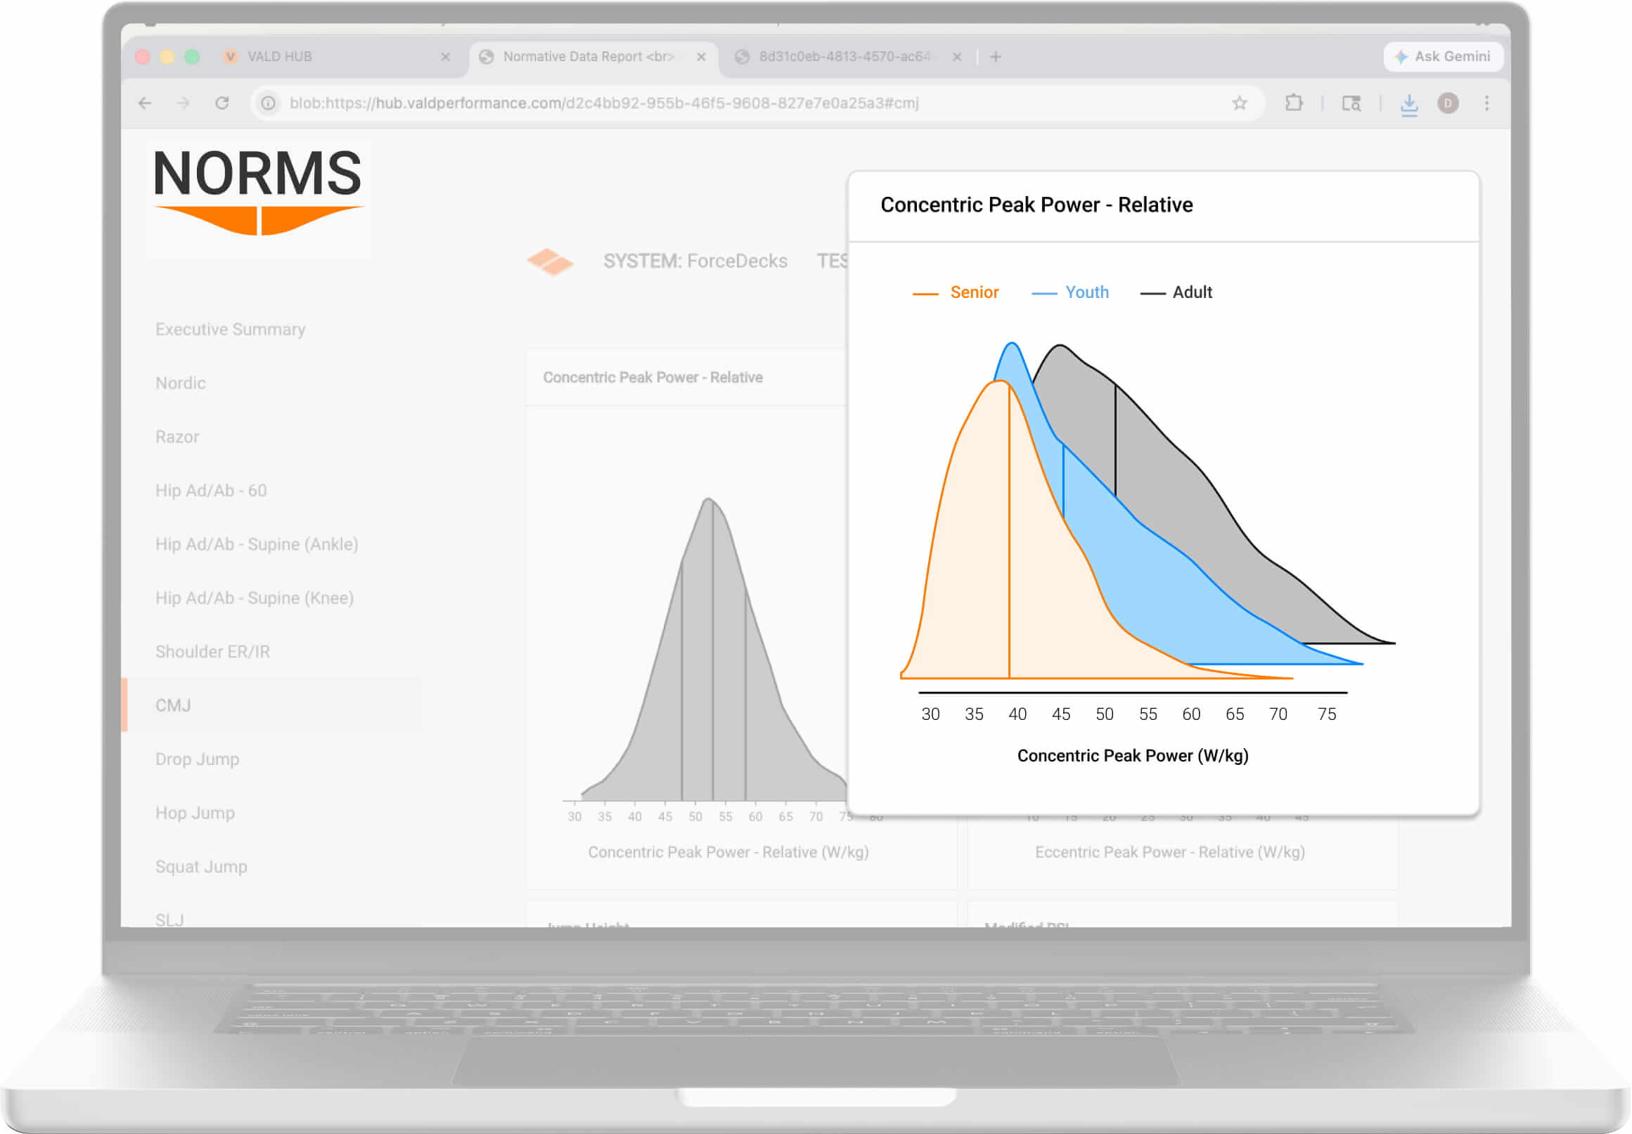
Normative data density plots for CMJ concentric peak power displayed in VALD’s Normative Data Reports. For more information on normative data, refer to our What are Norms? Understanding normative data article.
Defining VALD standards
In the VALD context, standards (capital N) refer to normative data directly integrated into the VALD database. VALD Systems. For example, practitioners can compare data relating to an individual's strength, jump or movement with reference values corresponding to their age and gender, directly within the application. Hub VALD or system-specific applications such as Power bridges or ForceFrame.
If you are new to VALD’s Norms, our Introducing VALD Norms article describes how they are integrated across VALD systems and applied in practice.

Standards are generated from statistically cleaned and analyzed datasets drawn from millions of test results. These reference values are available on VALD platforms such as VALD Hub and VALD mobile apps (for example, the ForceDecks iOS app), providing practitioners with context to inform clinical and performance decision-making.
Norms are integrated in two forms: percentiles and descriptive intervals. Most often, they are presented numerically in the form of percentiles, for example :
- A result in the 50sth represents the median of the population, or the typical "average" result.
- Results within 75th The percentile indicates that a measurement is above 75% of the population.
Percentiles allow practitioners to quickly understand how a result compares to others with similar characteristics, while people using applications such as the MoveHealth or systems such as HumanTrak can see standards presented as descriptive ranges to facilitate interpretation: below, within or above normal.
Percentiles allow practitioners to quickly understand how a result compares to others with similar characteristics...

Normative data comparisons in the MoveHealth app for both right and left sides, written in athlete-friendly language.
These values and ideas support informed decision-making and provide individuals with a clear context for interpreting progress in relation to their peers.
Population-specific normative data
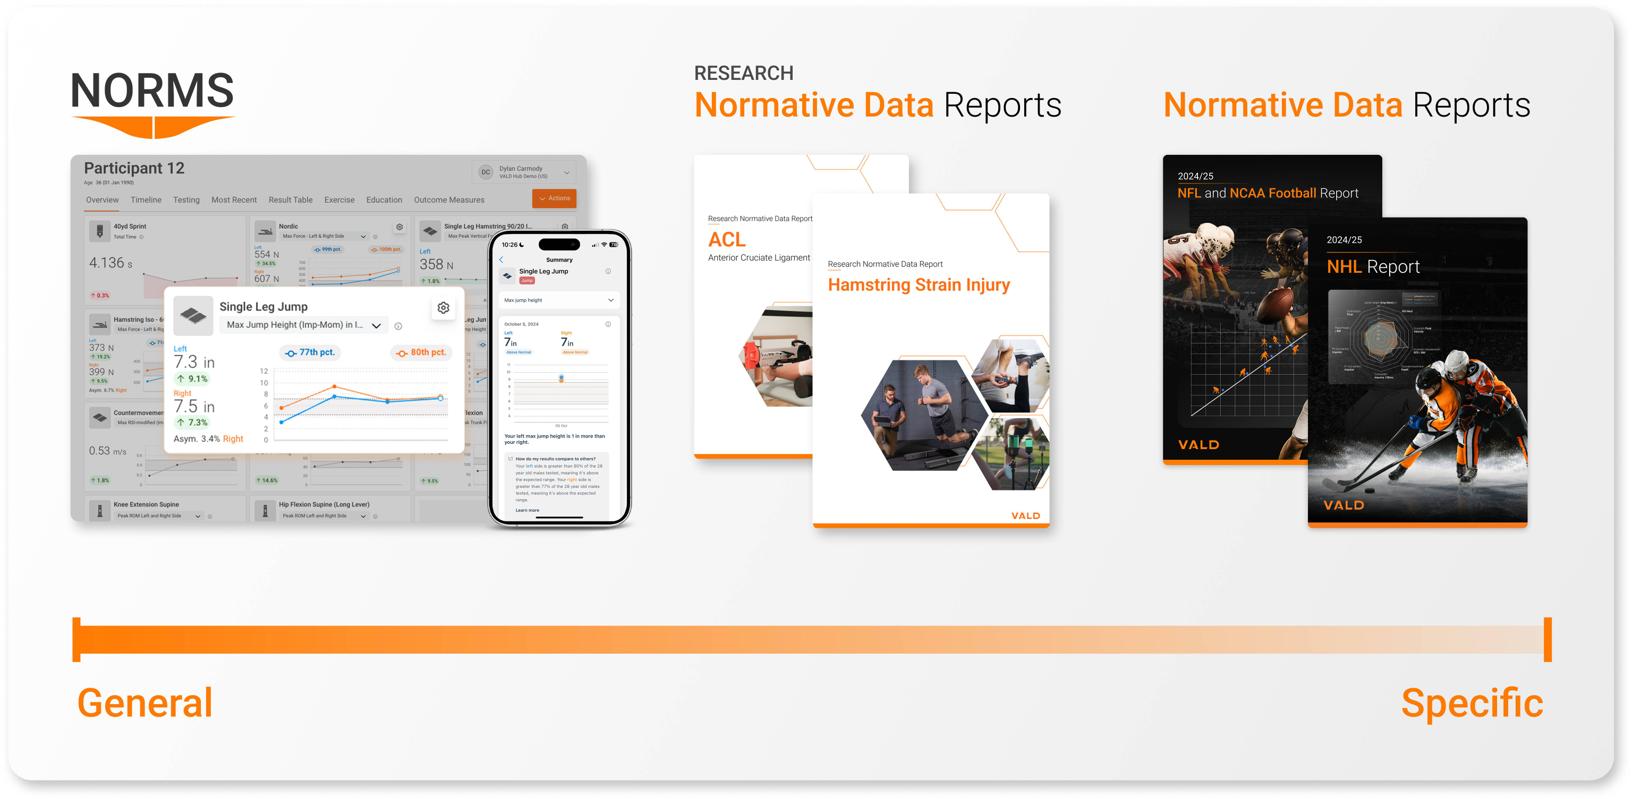
In addition to integrated data sets such as Norms, practitioners can also use more specific normative data from published reports and research articles. These reports summarize performance trends within specific populations, often grouped by sport, position, level of competition or testing environment, and are designed to highlight typical group performances in common assessments.
...reports summarize performance trends within specific populations... and are designed to highlight typical group performance in common assessments.
For example, the NFL and NCAA Football Report 2024/25available in VALD Hub, describes the performance of National Football League (NFL) and Division I athletes on common tests such as the CMJ, isometric mid-thigh pull (IMTP) and endurance test. drop jump (DJ)among many others.
Similarly, the VALD Hub has research normative data reports specific to conditions such as anterior cruciate ligament reconstruction (ACLR) and hamstring strain (HSI). These reports provide practitioners with research-based benchmarks throughout the rehabilitation process for ACLR and hamstring injury.
Standards and normative data vary in their degree of specificity, which influences how they are used in practice. As specificity increases, the benchmark becomes more relevant to the population being assessed.
Not all normative data sets are identical
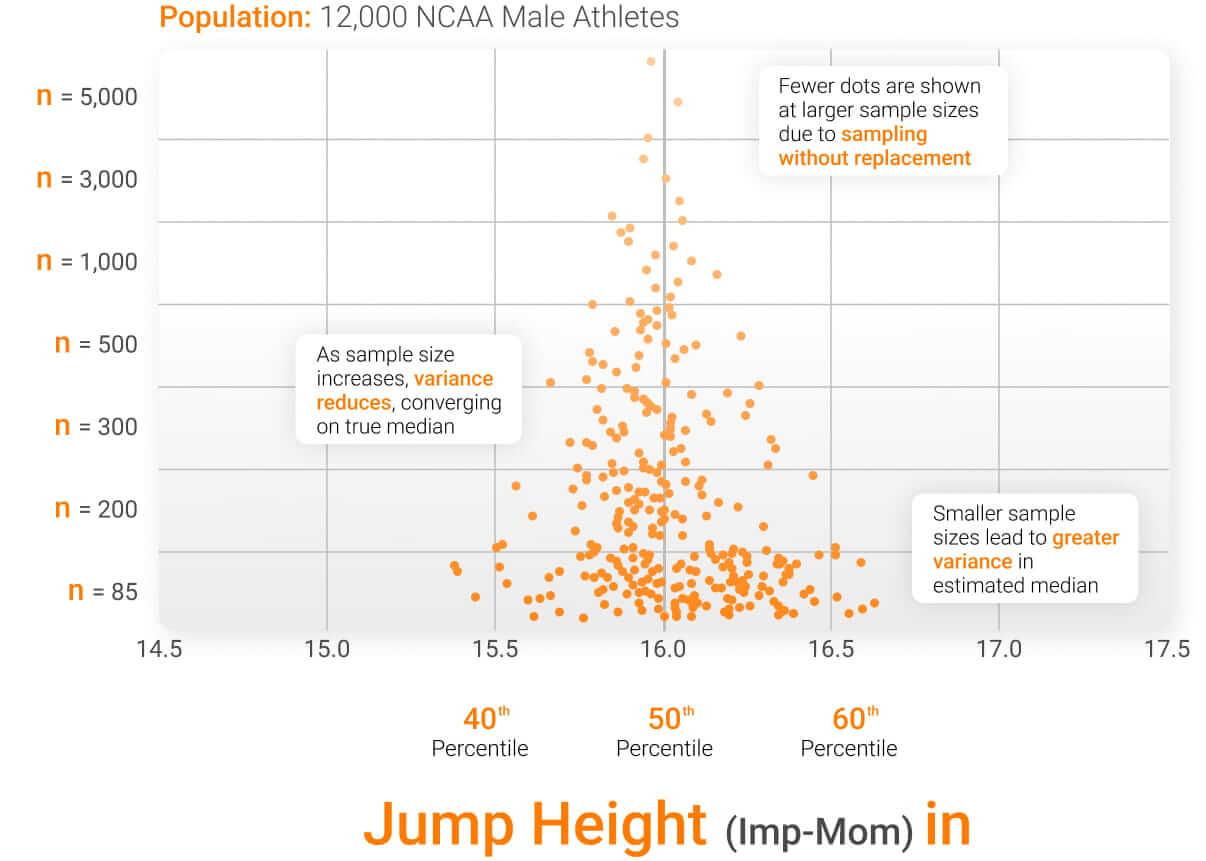
One of the main factors influencing the reliability of normative data is sample size. Small data sets (e.g. less than 100 samples) often produce unstable estimates of population performance. With few observations, metric medians or percentile thresholds can change dramatically as new data are added, making them unreliable reference values.
Small data sets (e.g. less than 100 samples) often produce unstable estimates of population performance.
In the figure below, each orange dot represents the median jump height for a variable sample of the data set. When the sample size is small (e.g. 85 observations), the estimated median varies considerably depending on the data points selected, producing values between around 15.4 and 16.6 inches (in) (more than 7% difference between values). As the sample size increases, estimates become more consistent and begin to converge towards the true population median.
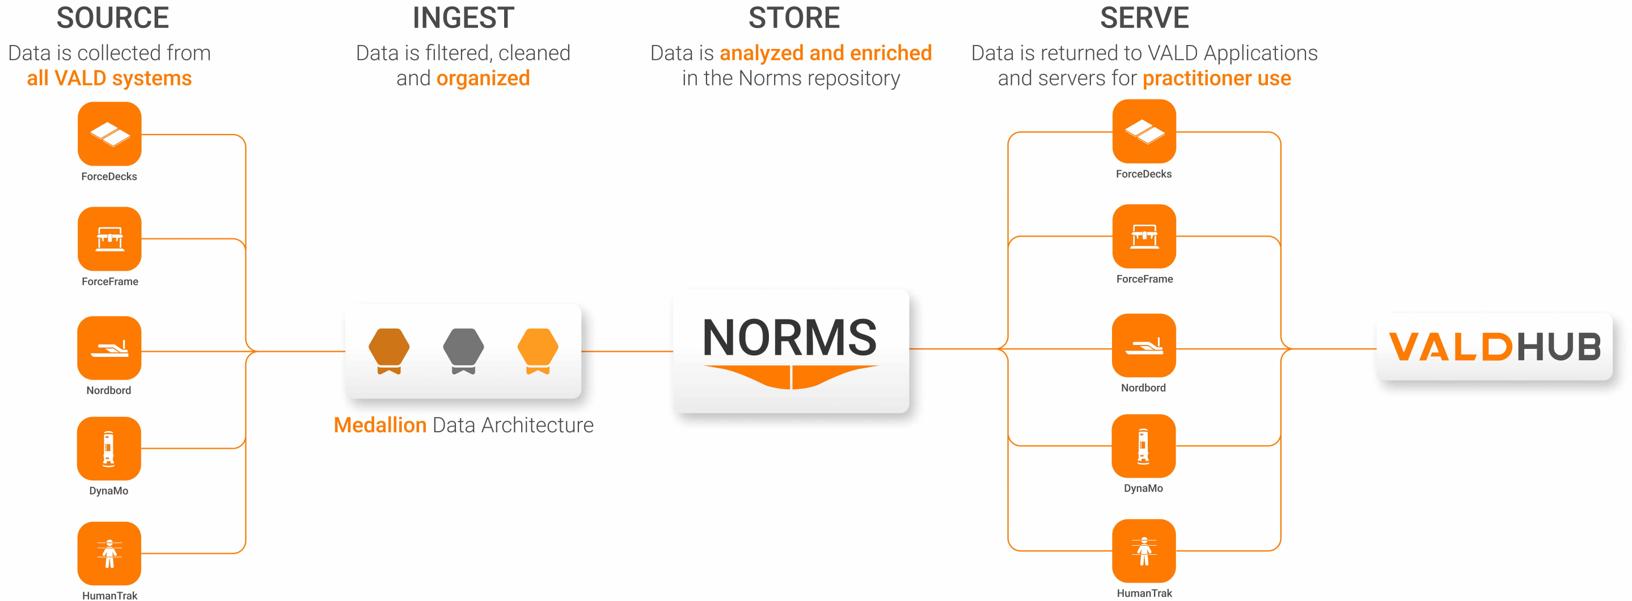
This underlines the need for large volumes of data to stabilize normative data sets such as standards. To achieve this, VALD uses the Data Lakehouse, which is based on over 100 million tests carried out by millions of individuals in tens of thousands of organizations. In practice, normative data sets ideally contain :
- Hundreds or thousands of observations per sub-group
- Clear separation by age, gender and test type
- Consistent test protocols across organizations
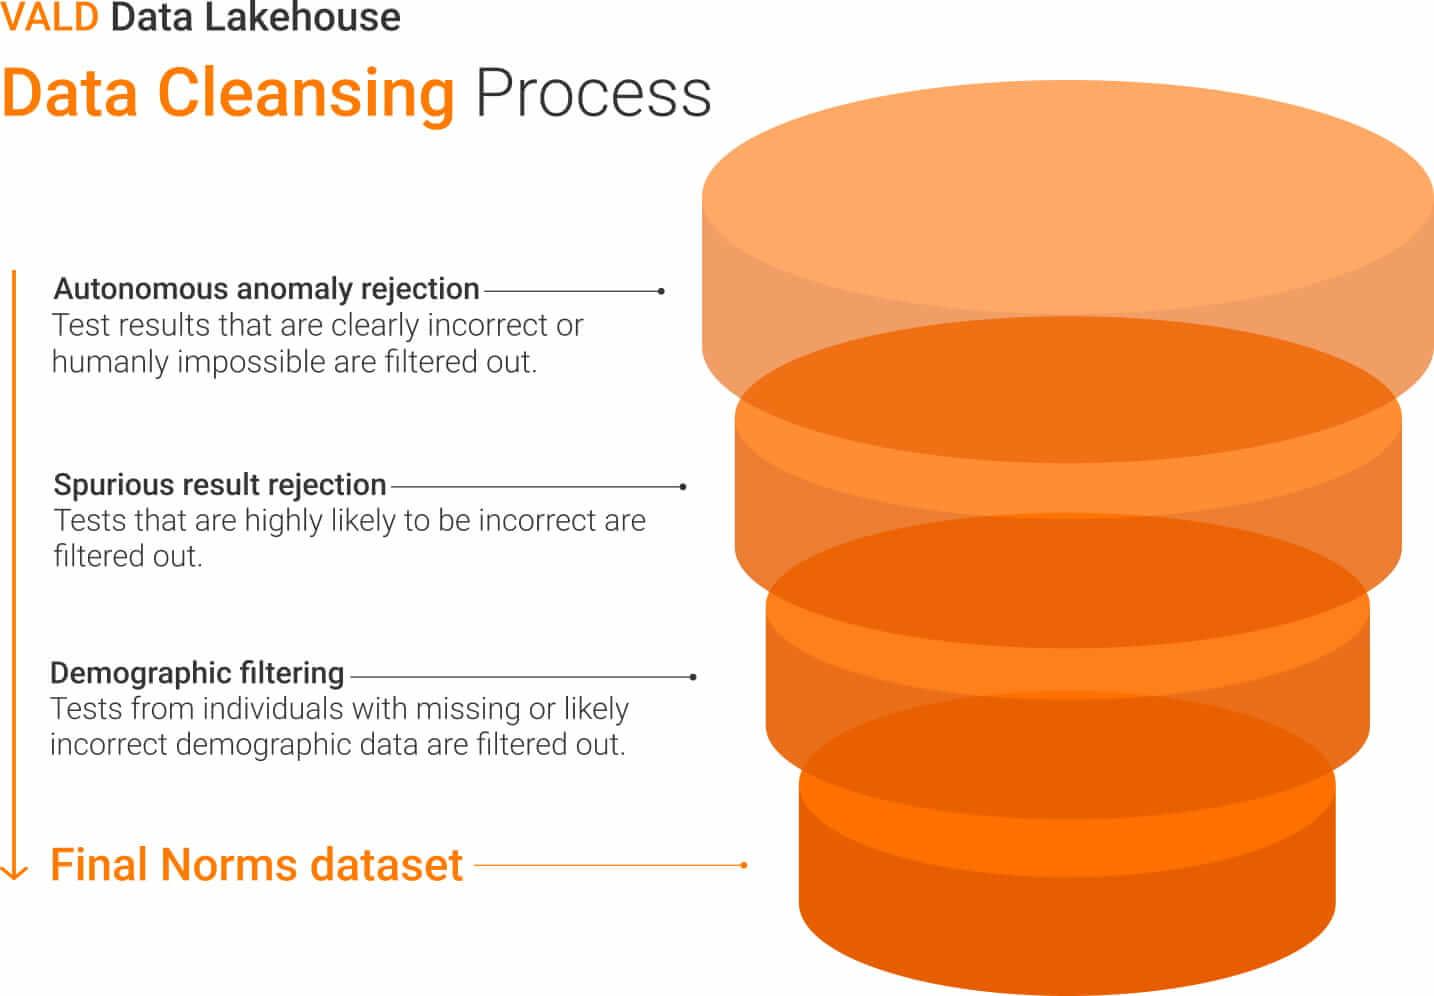
VALD’s data cleansing process controls for poor test execution and improper data through anomaly and spurious result rejection and demographic filtering.
However, data set size alone does not guarantee quality. Normative data sets must also be carefully cleaned and validated before they can be used to generate reliable reference values. Inaccurate data can distort normative distributions and, ultimately, lead to uninformed decision-making.
Normative data sets must also be carefully cleaned and validated before they can be used to generate reliable reference values.
Before generating normative reference values, data sets are subjected to multiple filtering and validation steps to ensure data accuracy and representativeness, as shown in the figure below.
How are normative data calculated?
Once the datasets have been cleaned and validated, statistical modeling techniques are used to generate the standards we see and use in the VALD Hub.
Most normative data sets produce percentile curves that describe the evolution of performance according to age and gender groups.
One commonly used method is Lambda, Mu, Sigma (LMS), which has been widely applied to biological data to model age-related reference curves and generate smoothed percentile distributions across populations. The LMS approach models three parameters:
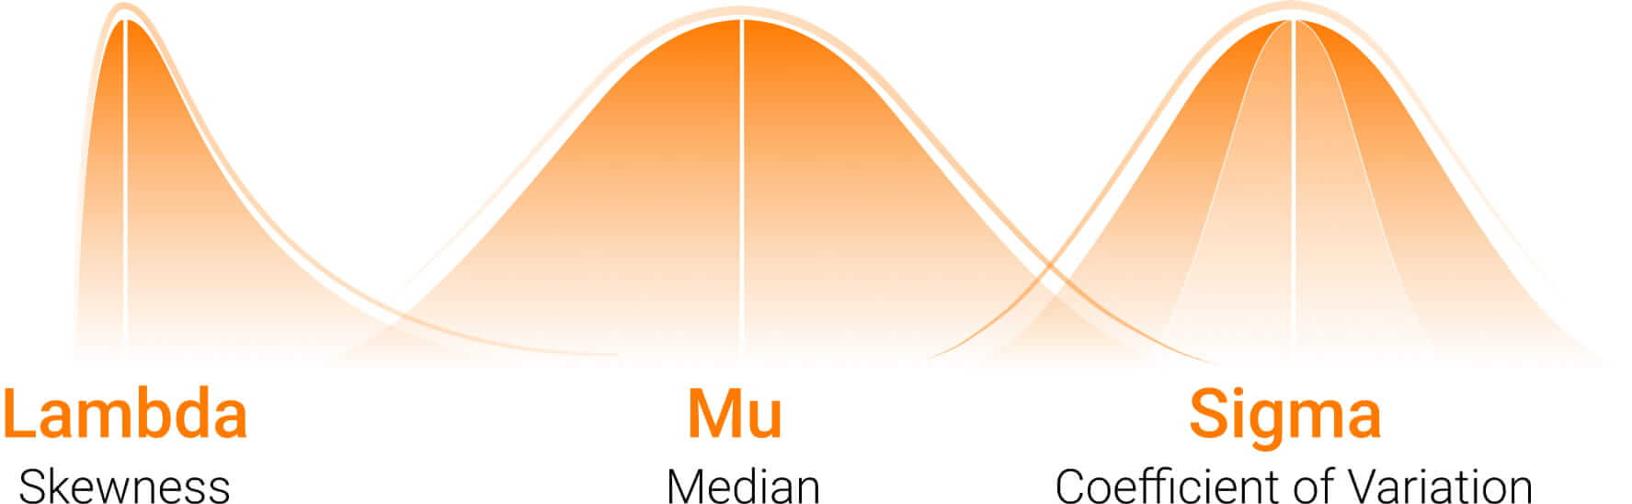
- Lambda (L): Distribution asymmetry (the degree of symmetry or asymmetry of the distribution curve)
- Mu (M): Population median (point at which half the observations are above and half are below)
- Sigma (S) : Coefficient of variation (the relative deviation, which describes the extent of variability around the median)
All these parameters can be used to calculate percentile curves for different ages and demographic groups, enabling simple and effective comparisons.
The future of normative data
Advances in data science are increasing the capabilities of large-scale musculoskeletal datasets. As test platforms continue to collect large volumes of data from diverse populations, normative datasets are becoming increasingly comprehensive.
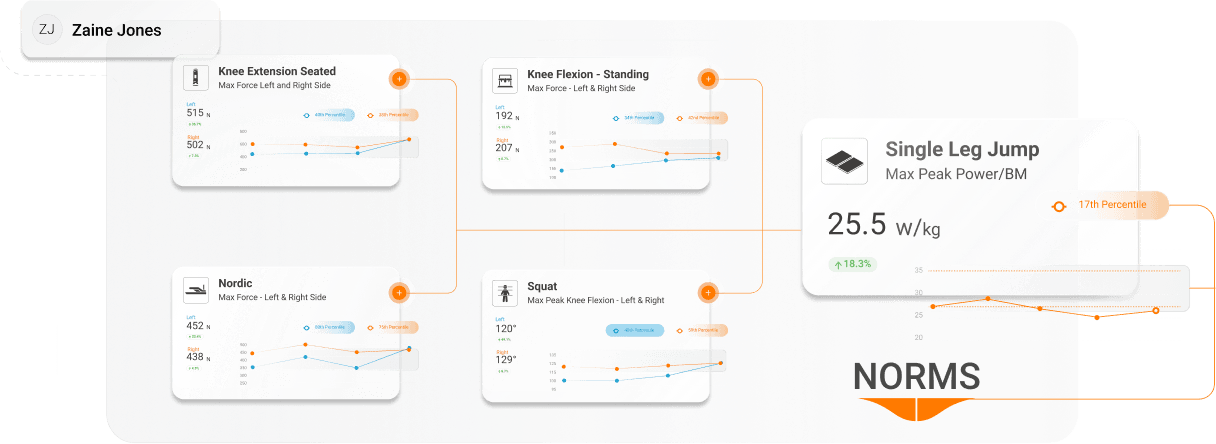
VALD Hub tiles allow specific categorization and analysis of nearly all VALD test metrics.
VALD is continually improving the provision of high-quality normative data that accurately represents real-world populations. This includes strengthening population metadata, consolidating data quality controls and investigating new statistical modeling techniques.
As data sets grow, normative reference values will become increasingly accurate and representative of real-world populations.
As data sets grow, normative reference values will become increasingly accurate and representative of real-world populations.
Key findings
Normative data, including VALD standards, play an important role in transforming objective measurements into usable data. By comparing individual results with population reference values, practitioners gain the context they need to interpret performance, identify potential limitations and guide decision-making.
However, the value of normative data depends on several key factors, including large and representative data sets, rigorous data cleaning and sound statistical modeling. When these elements are in place, normative data becomes a powerful tool for practitioners working in the fields of sport, health and performance.
To find out how standards can help contextualize testing and make clearer decisions, explore the VALD Hub or get in touch with our team.