My Dashboard: Sean Baker
Available in:
EN
My Dashboard is a series featuring insights from health and performance experts on the tests and metrics they use to identify performance and rehabilitation deficits. Each article breaks down their VALD Hub dashboard, which has been optimized for a specific type of athlete or patient, outlining key tests, metrics and training insights to help practitioners better integrate testing data into practice.
Contributor

Sports Profile
Professional soccer environments generate large volumes of performance data, making it critical to identify which metrics meaningfully influence performance and availability. Therefore, Sean’s dashboard combines objective neuromuscular and strength profiling with wellness monitoring to help detect important changes early and guide decision-making throughout a congested season.
Professional soccer environments generate large volumes of performance data, making it critical to identify which metrics meaningfully influence performance and availability.
Concern typically arises when multiple metrics change together, allowing the dashboard to add context to decision-making rather than drive conclusions in isolation.
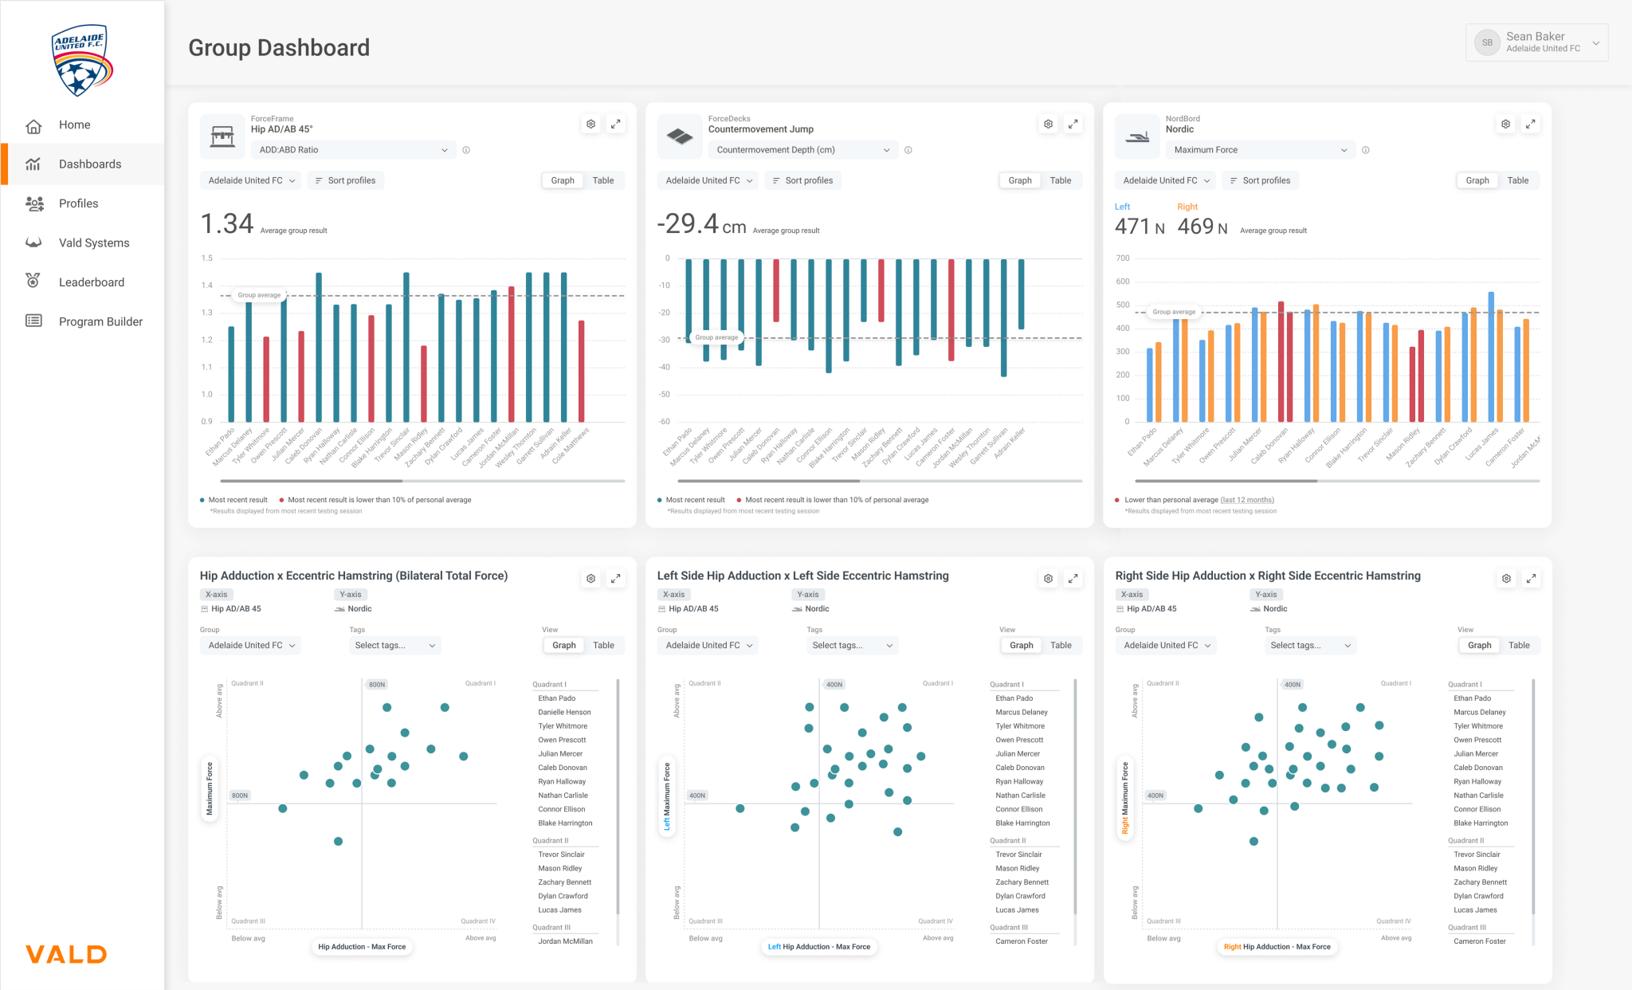
Sean’s VALD Hub dashboard highlighting jump and isometric monitoring data for athlete readiness.
Overview
This dashboard combines wellness monitoring, neuromuscular profiling and strength assessment to support decision-making within a professional soccer environment. By integrating ForceFrame, ForceDecks and NordBord data, Sean uses the dashboard to help identify meaningful changes in performance, readiness and robustness throughout the season.
His dashboard also emphasizes features displayed in the Group Monitoring Dashboard, such as flagging trends using monitoring charts and comparing related metrics through quadrant charts. These features allow him to contextualize individual metrics and focus on athletes who show multiple converging flags.
Hip Adduction and Abduction 45°
![]()
| Test | Metric | Programming Consideration |
 | Peak Force Adduction |
|
| Peak Force Abduction | ||
| Adduction-to-Abduction Ratio |
|
Sean assesses hip adduction and abduction strength weekly using ForceFrame to monitor changes in force production, limb symmetry and longitudinal trends across the season. In soccer, adductor function is particularly important due to the repeated demands of sprinting, deceleration, change of direction and kicking.
Rather than comparing athletes to generalized normative data, his dashboard flags athletes who fall more than 10% below their individual 90-day rolling average, allowing changes to be interpreted within the context of each athlete and their current training load.
…his dashboard flags athletes who fall more than 10% below their individual 90-day rolling average, allowing changes to be interpreted within…context…
He also monitors the relationship between eccentric hamstring strength and hip adduction strength, as discussed in the Quadrant of Boom Part 3 article. Declines across both metrics can indicate reduced sprint robustness and often increase attention toward training exposure and readiness.
Countermovement Jump (CMJ)
![]()
| Test | Metric | Programming Consideration |
 | Reactive Strength Index-Modified (RSI-Mod) |
|
| Eccentric Peak Velocity (EPV) |
| |
| Countermovement Depth |
| |
| Contraction Time |
|
CMJ profiling is conducted fortnightly using ForceDecks, allowing Sean to monitor neuromuscular performance and movement strategy across the season. Although testing was previously performed weekly, increased testing frequency was found to reduce athlete intent over time, particularly within metrics like EPV. Fortnightly testing ultimately provided the best balance between collecting actionable data and preserving movement quality and effort.
RSI-Mod is the primary metric on his dashboard, and athletes are generally considered stable if they remain within 10% of their 90-day rolling average.
When athletes move outside that range, he assesses metrics such as EPV, countermovement depth and contraction time to explore how the jump was achieved. This helps identify changes in movement strategy or efficiency that may not be visible through jump height alone.
When athletes move outside that [10% range for RSI-Mod performance], he assesses metrics such as EPV, countermovement depth and contraction time…
Nordic
![]()
| Test | Metric | Programming Consideration |
 | Relative Eccentric Peak Force |
|
| Asymmetry |
|
Sean assesses eccentric hamstring strength monthly using NordBord, primarily in relation to hip abduction and adduction strength as part of the Quadrant of Boom framework. Unlike the standalone CMJ and hip strength assessments, Nordic testing is embedded in the athletes’ normal gym programming, with data collected during the first maximal eccentric set of the session.
…Nordic testing is embedded in the athletes’ normal gym programming, with data collected during the first maximal eccentric set of the session.
From a monitoring perspective, monthly testing has provided sufficient frequency for him to identify meaningful changes and support decision-making without creating unnecessary data volume.
How These Tests Integrate
A key aspect of Sean’s process is understanding how different assessments can be integrated to provide a more complete picture of athlete status. Wellness questionnaires, ForceDecks jump testing, ForceFrame strength assessments and NordBord profiling each contribute unique information, but their value is amplified when viewed together through quadrant charts and longitudinal trend analysis.
Rather than focusing on a single metric in isolation, quadrant charts allow him to combine measures across multiple systems to identify athletes who may warrant closer attention. For example, an athlete displaying reduced RSI-Mod alongside lower adductor strength may present a different risk profile than an athlete with only one flagged measure. By bringing these assessments together into a single framework, he can quickly identify patterns that might otherwise go unnoticed.
…quadrant charts allow him to combine measures across multiple systems to identify athletes who may warrant closer attention.
This integrated approach also helps provide context around performance changes. Individual fluctuations are common throughout a season and do not always require intervention. However, when multiple measures begin trending in the same direction, quadrant charts can help highlight meaningful changes and support earlier conversations around training load, recovery strategies or athlete management.
Ultimately, the goal is not to collect more data, but to combine complementary assessments in a way that improves his decision-making. By integrating subjective and objective measures within a single dashboard, Sean can more effectively monitor performance, robustness and availability throughout the season.
Interested in building your own dashboard or applying similar methods to athlete monitoring and decision-making? Get in touch with our team.