Introducing valdr: Direct, flexible access to your VALD data
Available in:
EN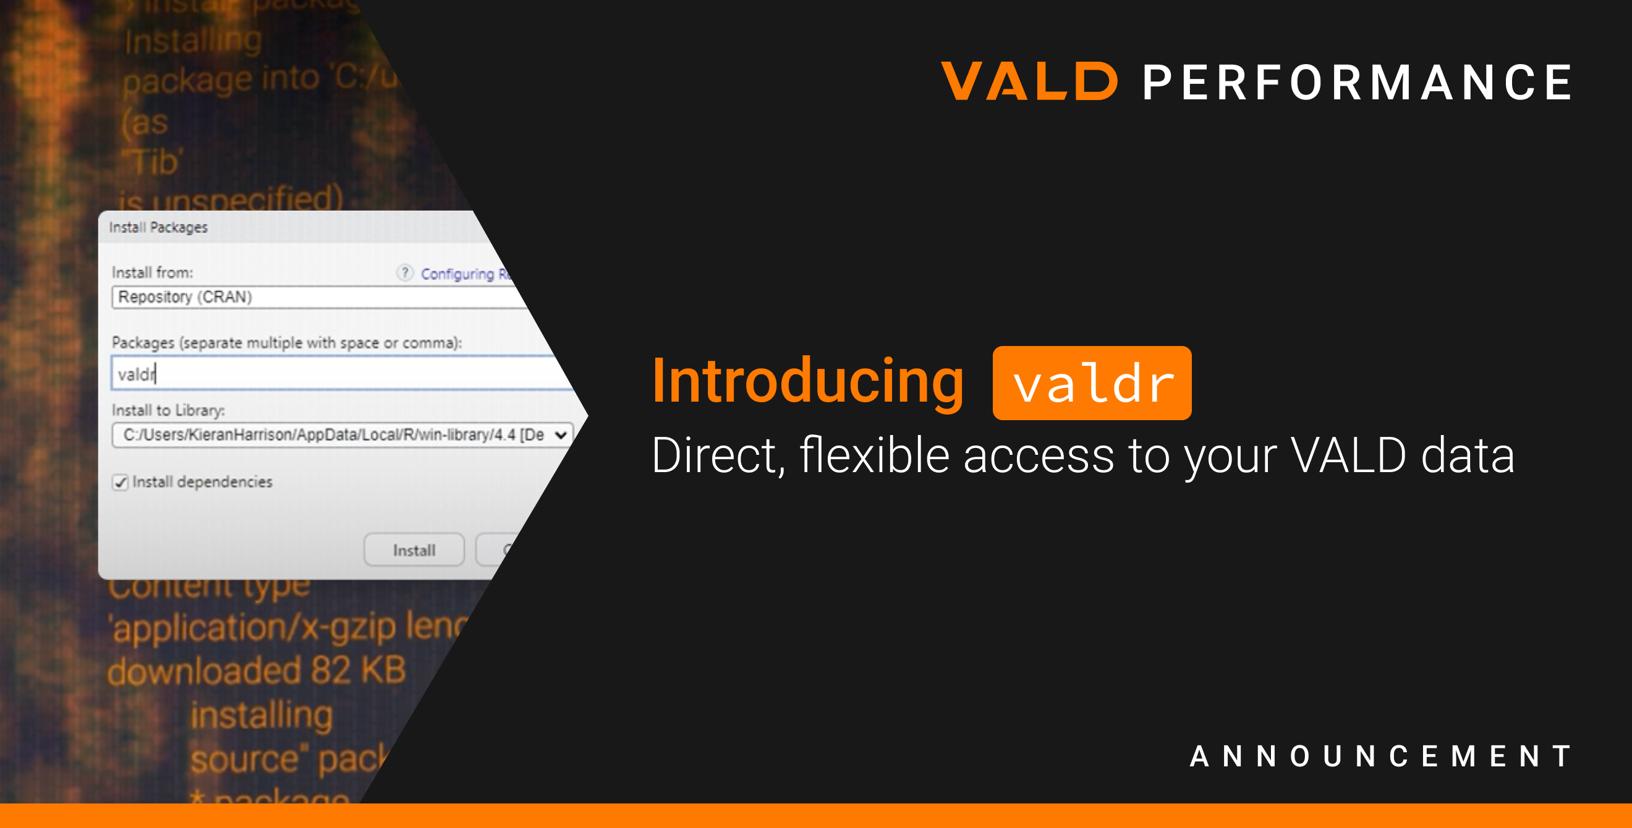
For many people, working directly with application programming interfaces (APIs) may involve a steep learning curve. valdr allows users to analyze their own data without relying solely on third-party application and management service (AMS) providers or any additional systems. Built with ease of use and autonomy in mind, this package allows for data analysis on a more granular level, reducing the technical barriers associated with working with your raw data.
Currently, valdr supports integration with ForceDecks, ForceFrame, NordBord and SmartSpeed, with expanded support for other VALD systems planned in the future.
Why valdr?
While VALD’s External APIs have long enabled access to granular testing data, working with them has typically required a reasonable amount of technical expertise. valdr simplifies this process, especially for users with limited API experience. Using valdr, users can:
- Automate and extract detailed raw data with minimal setup
- Build tailored dashboards and reports
- Integrate VALD data alongside existing business intelligence tools and insights
- Conduct their own bespoke analysis and research using raw data
Key Benefits of valdr
valdr provides a streamlined way to extract raw, detailed-level data with minimal setup requirements to build meaningful integrations and custom reports for research and analysis.
These are the key benefits:
- Fast Access: Test data syncs to VALD’s APIs almost immediately, making it available for analysis shortly after testing.
- Open Source: valdr is available on CRAN – the central repository for R packages – making installation and updates simple.
- Secure by Design: Credential management and token-based authentication are handled out of the box.
- Flexible and Scalable: Supports custom visualization, research, trend analysis and future multi-product data integration.
- Repeatable Workflows: You can create your own z-scores or key performance indicators (KPIs) aligned with internal priorities and share repeatable data processes across teams.
Real-World valdr Use
Here is a real-world example of a performance-focused organization using valdr to assess countermovement jump (CMJ) data across its squads.
They are reviewing the data to investigate whether there is any relationship between reactive strength index-modified (RSI-Mod) scores and athlete ages. Their goal is to better understand how reactive strength may vary across different stages of an athlete’s career.
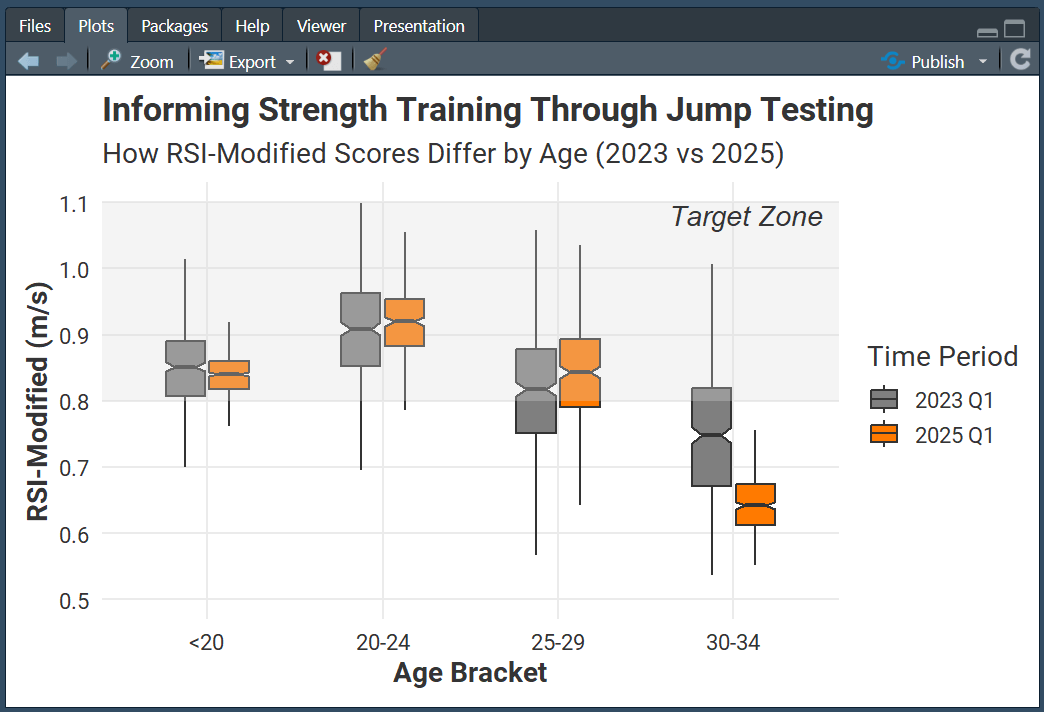
Using valdr to find the relationship between RSI-Mod scores and athlete ages.
Using valdr, they quickly extract and visualize ForceDecks data across multiple athletes. With these insights, they enable individualized insights without waiting on external reporting pipelines. As such, they can conduct data-informed training that contributes to longer, higher-quality athletic careers.
Who Is valdr For?
Whether you are in performance, rehabilitation or research, valdr offers a way to take granular control of your data. You can create repeatable reporting processes, generate custom KPIs and gain insights that matter most to your organization. valdr provides greater flexibility and independence – all from within the R environment.
Ready to give it a go? Here is our guide to using the valdr R package.