Fatigue, Travel and Performance Monitoring in Baseball
Available in:
EN
About the Author
Prof. Hugh Fullagar is a Senior Academic in Sports Science and Senior Researcher at Aspetar, working across elite sport, healthcare and the military to optimize performance. Beyond education, his career also involves consulting in the National Football League (NFL), the National Basketball Association (NBA) and elite European football, with a focus on providing tailored, collaborative and evidence-based support.
The demands of the modern Major League Baseball (MLB) season continue to intensify, with more games in tighter windows, long-haul travel and late-night scheduling compounding stress and athlete fatigue. However, athlete availability is critical for athlete performance, organizational success and overall league health. The relationship between fatigue and availability is complex, requiring practitioners to look beyond surface-level indicators to define best practices in fatigue management.
The relationship between fatigue and availability is complex, requiring practitioners to…define best practices in fatigue management.
Shoulder and elbow injuries remain the leading causes of lost playing time, with injury rates continuing to rise since the late 1990s (Ashworth et al., 2025). Much like hamstring injuries in elite football, increased awareness has not translated into reduced injury rates. Injury risk is consistently at its highest early in the season, reinforcing the importance of off-season preparation, objective monitoring and safe transition into competitive periods (Posner et al., 2011).

This article outlines key demands, assessment methods and thresholds practitioners can use to manage athlete fatigue more effectively.
Travel, Sleep and Athlete Fatigue
Travel remains a primary challenge for recovery in baseball and other elite sports leagues due to the constant travel demands, with MLB athletes often accumulating more than 40,000 air miles per season. Frequent travel across time zones disrupts sleep habits and can lead to chronic sleep deprivation, which is associated with declines in physical performance among elite baseball athletes (Song et al., 2016).
Fatigue affects outcomes beyond physical performance, with research linking chronic fatigue to:
- Reduced accuracy in strike zone recognition across a regular season in 80% of MLB teams (Kutscher et al., 2013)*
- Associations with shorter career longevity (Winter et al., 2013)*
* These citations are conference abstracts and are therefore not directly linkable.
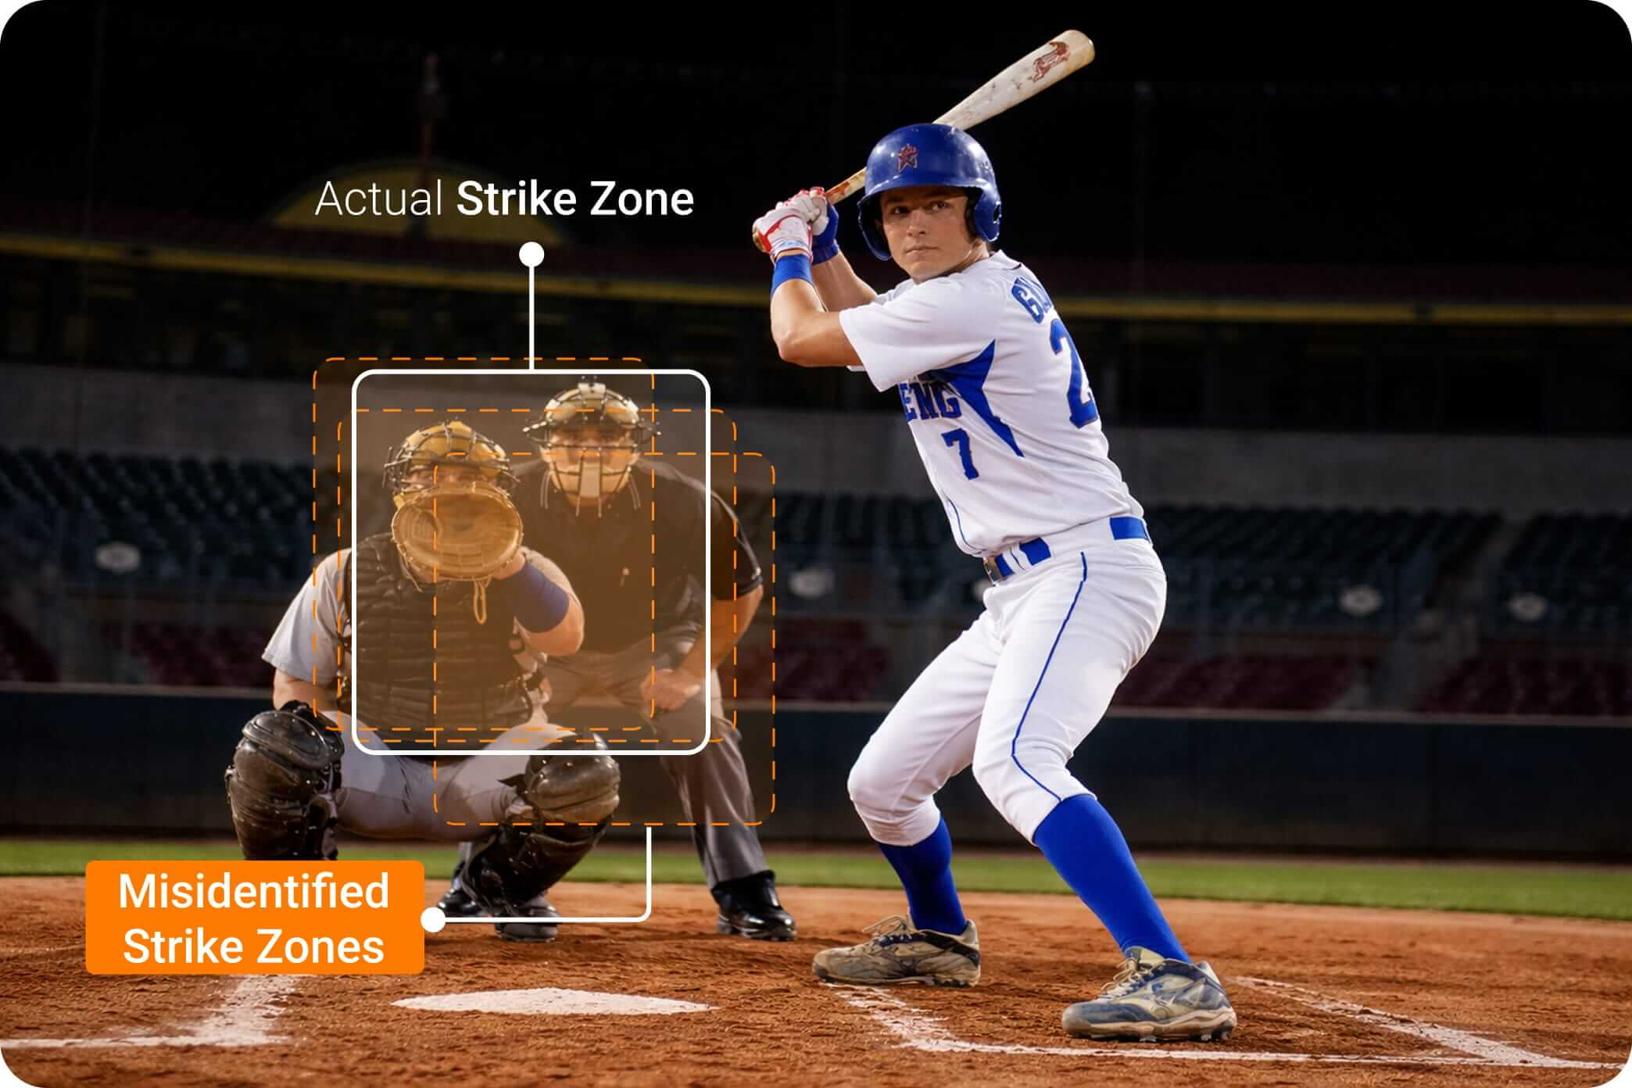
[Fatigue leads to] reduced accuracy in strike-zone recognition across a regular season in 80% of MLB teams.
Stress and fatigue can be amplified when typical athlete training loads are combined with rigorous travel demands. This creates a complex relationship between physically demanding stressors – such as training volumes, playing times and skills sessions – and stressors that originate outside the training environment, including travel, sleep disruption and schedule congestion.
Centralized platforms like VALD Hub help address this gap by consolidating physical, perceptual and contextual data into a single environment, allowing practitioners to monitor physical performance trends and key outcome measures more effectively across the season.
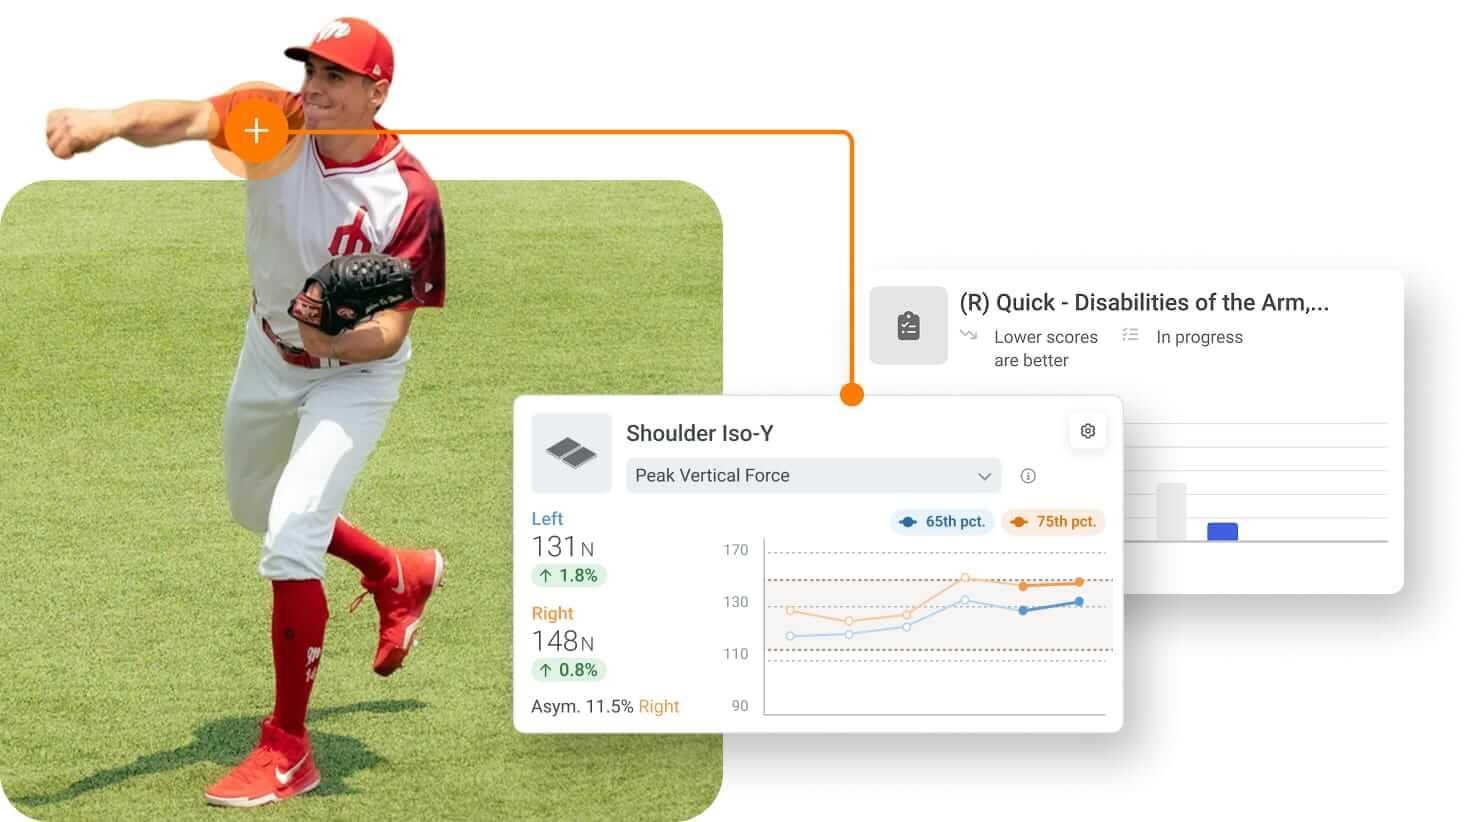
Longitudinal data tracking from ForceDecks and MoveHealth to monitor an athlete’s progress during a return-to-throwing program.
Objective Testing in Baseball
Reliable testing is essential, especially for upper-body performance where overhead strength and force transfer underpin throwing velocity and durability. The following testing options present valuable insights into baseball rehabilitation and performance.
Reliable testing is essential, especially for upper-body performance where overhead strength and force transfer underpin throwing velocity and durability.
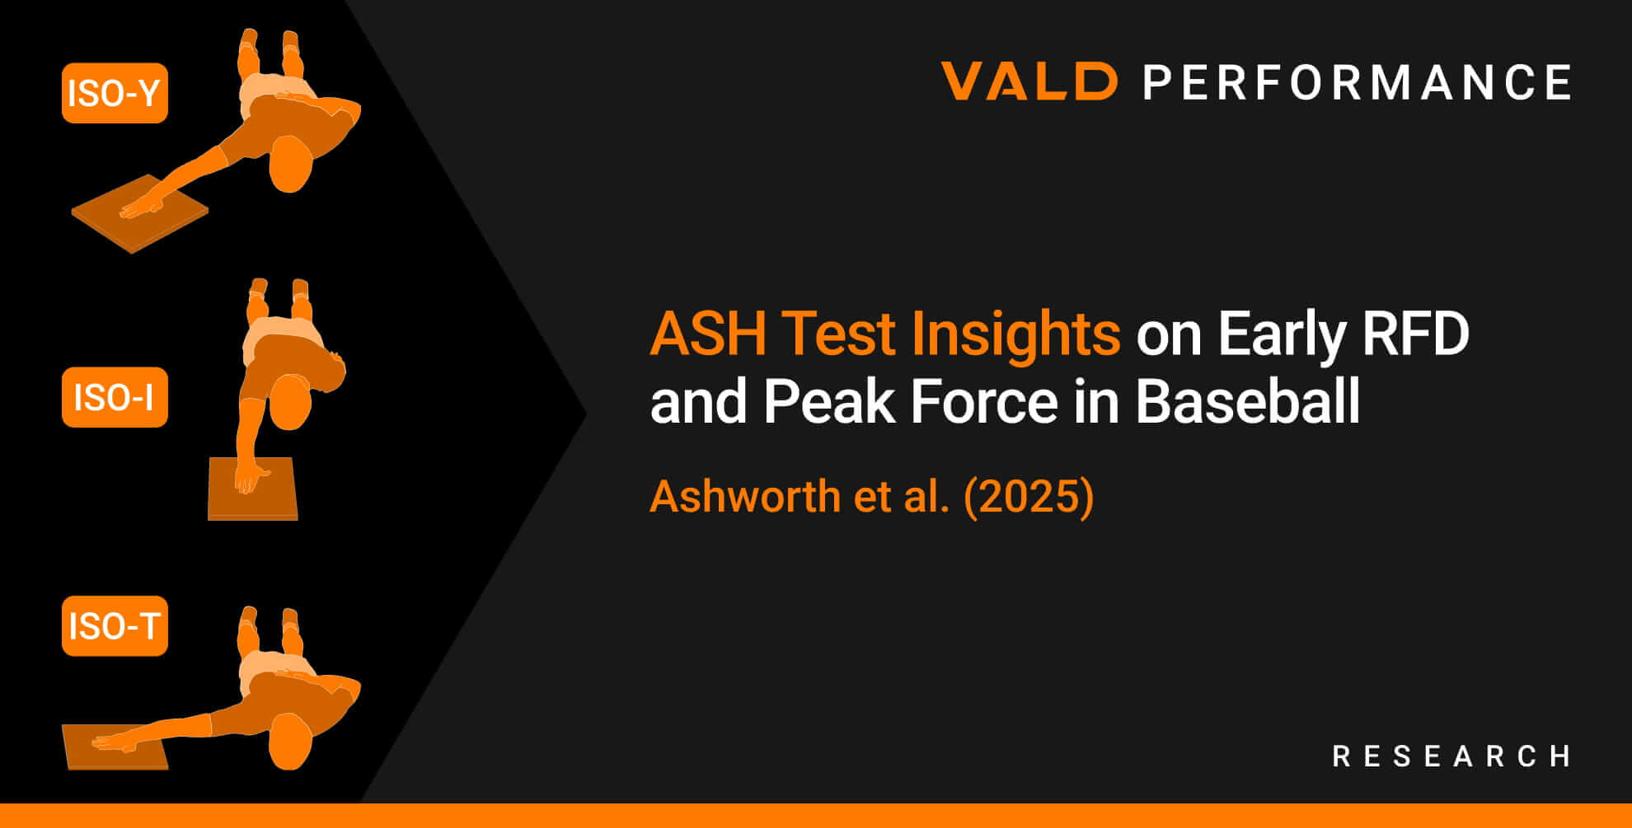
Upper-Body Isometric Testing
Precise measurements of peak force, rate of force development (RFD) and impulse, specifically during the Athletic Shoulder (ASH) test in the I, T and Y positions, enable practitioners to:
- Identify strength deficits
- Detect significant asymmetries between limbs
- Monitor adaptations during high-throwing periods
- Quantify readiness throughout the season
When regularly assessed with technologies such as ForceDecks, ForceFrame and DynaMo, ASH testing supports more informed decision-making for athlete training and return-to-play scenarios.
Neuromuscular Fatigue
Force plate jump assessments, including countermovement jump (CMJ) and squat jump, provide insight into neuromuscular status in baseball athletes – particularly for field positions that rely on explosive first steps, lateral acceleration, diving and repeated high-intensity efforts (He et al., 2025).
Force plate technologies like ForceDecks enable consistent tracking of jump height, force-time characteristics and RFD to detect subtle fatigue-related changes across games, series and travel-heavy schedules.
…ForceDecks [enables] consistent tracking…to detect subtle fatigue-related changes across games, series and travel-heavy schedules.
These outputs add valuable context when interpreted alongside baseball-specific workload measures, such as:
- Throwing velocity trends across innings (Escamilla et al., 2007)
- Pitch counts and cumulative throwing volume
- Inertial measurement unit (IMU)-derived rotational and torque measures
- Sprint and base-running times
- Session rate of perceived exertion (RPE) and perceptual wellness scores (Dowling et al., 2020)
For practitioners looking to optimize their athlete assessment process, force plate-derived vertical jump metrics and isometric RFD remain among the most sensitive indicators of neuromuscular fatigue during congested competition periods. The following force plate CMJ metrics are commonly used in this context:
- Eccentric deceleration impulse
- Flight time to contraction time ratio (FT:CT)
- Reactive strength index-modified (RSI-Mod)
- Jump height
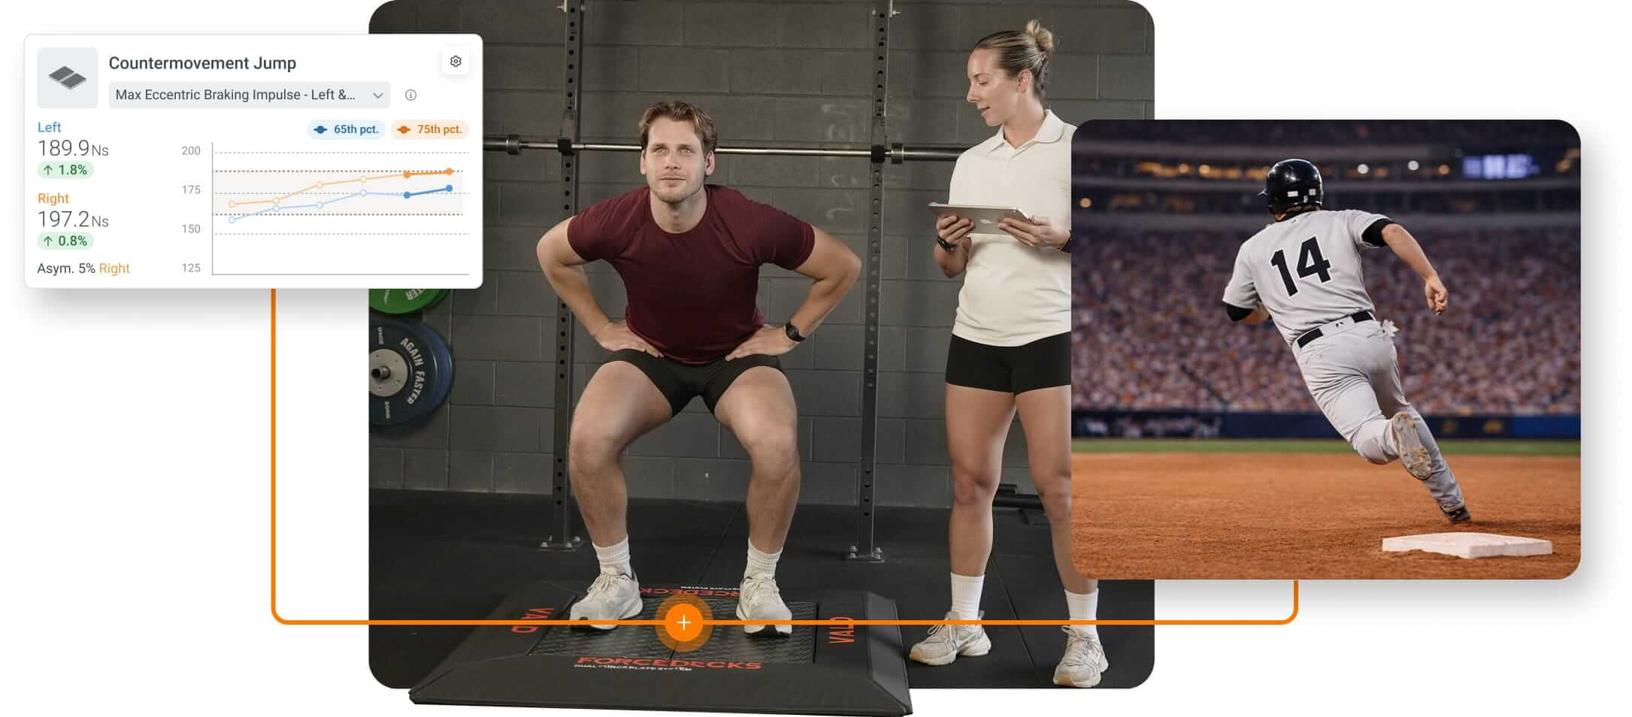
Baseball athlete undergoing a CMJ assessment to detect neuromuscular status for baseball performance.
Thresholds and Interpretation
When tracking fatigue or performance change, practitioners should avoid relying solely on statistical significance or generic thresholds (e.g., a 10% change from previous assessment). Key decisions must account for the following factors:
- Within-subject variability
- Minimal detectable change (MDC)
- Minimum clinically important difference (MCID)
Thorpe et al. (2017) demonstrate that combining statistical analysis with individualized reference points helps practitioners define meaningful fatigue thresholds, rather than reacting to normal day-to-day variation. This approach improves sensitivity to true change and supports more confident decision-making during congested competition periods.
…combining statistical analysis with individualized reference points helps practitioners define meaningful fatigue thresholds [in sport]…
Platforms like VALD Hub enable similar analyses by allowing practitioners to customize threshold calculations (e.g., percent change and z-score options). These options ensure that comparison or reference data used in the calculations are specific to the athlete, group or team and their general performance trends.
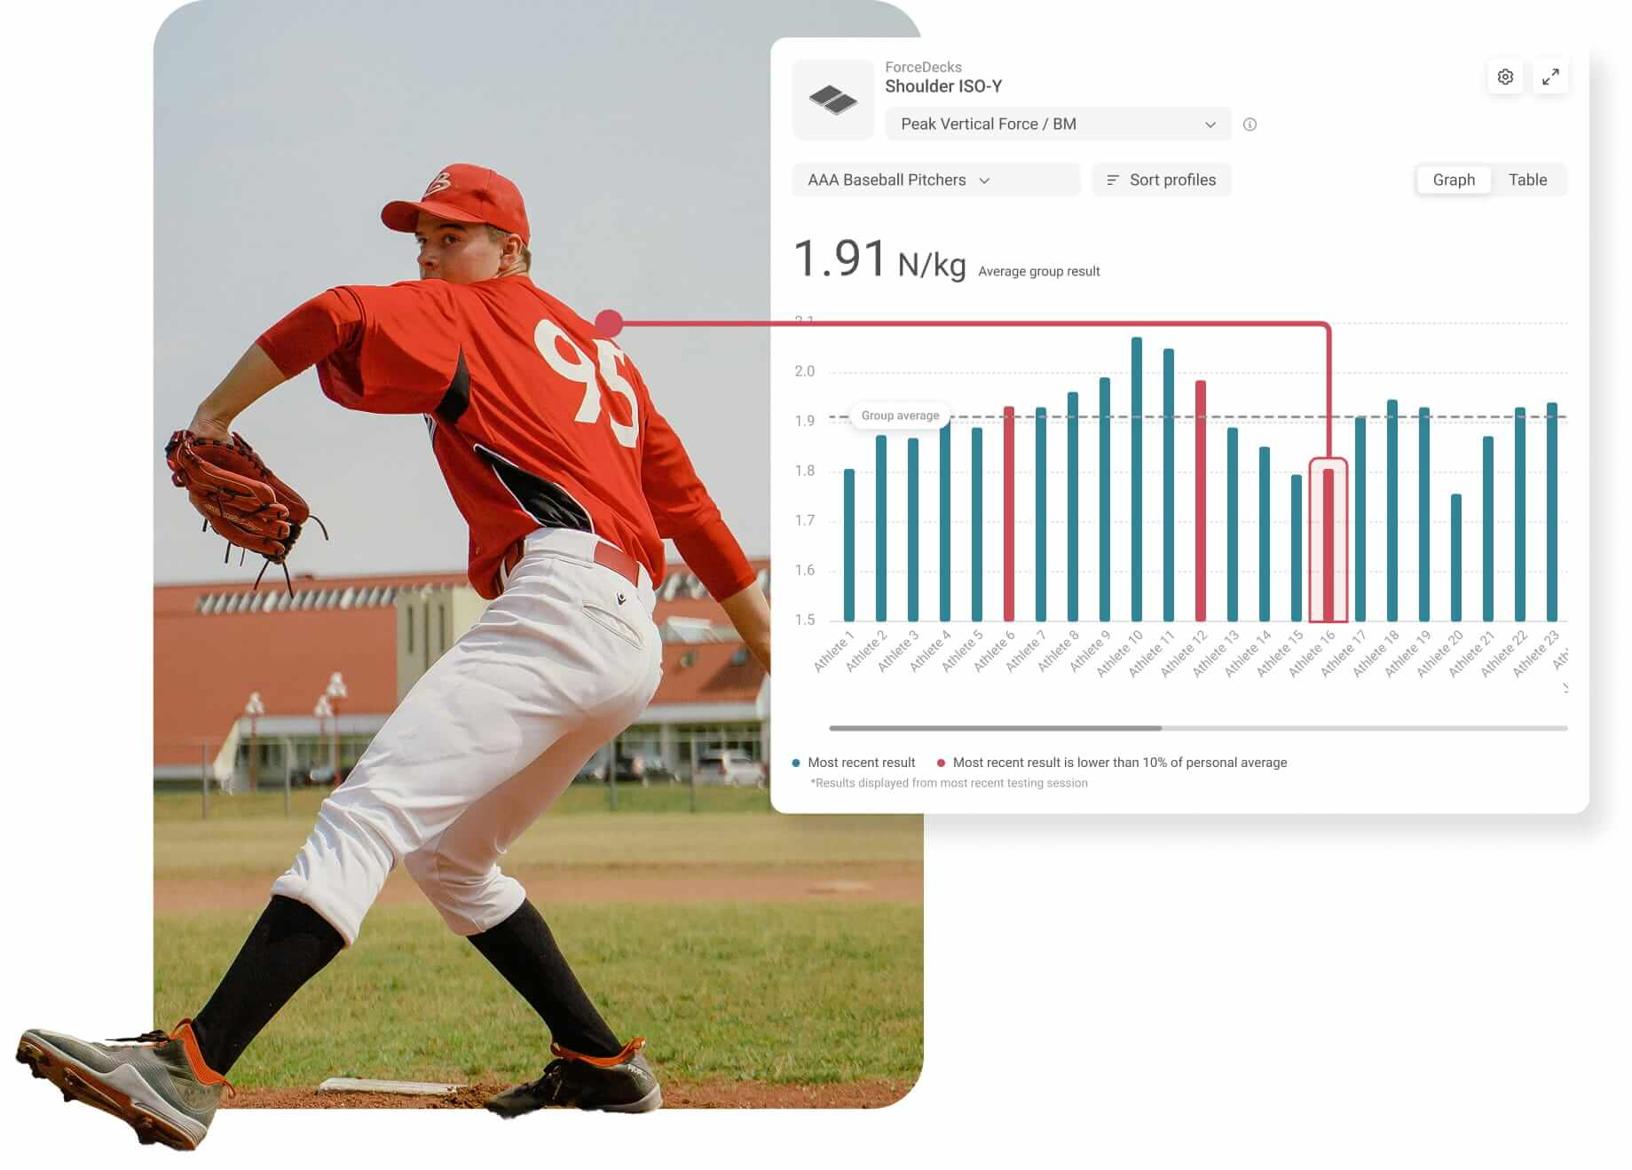
Pitcher’s ISO-Y test data reviewed within the Group Dashboard to support threshold interpretation.
Interpretation should also consider health economics. For example, the cost of lost game availability for a starting pitcher differs substantially from that of non-starters or prospects. Therefore, thresholds require input from athletes, coaches and leadership.
Meaningful thresholds are not universal; they must reflect the context, the athlete and the performance or availability consequences of the decision.
Meaningful thresholds are not universal; they must reflect the context, the athlete and the performance or availability consequences of the decision.
Summary
Extended baseball seasons place cumulative physical and cognitive demands on athletes, amplified by travel, night games and compressed schedules. While short-term performance drops may be subtle, the accumulated impact on readiness and availability becomes increasingly meaningful late in the season.
Objective measurement technologies, such as ForceDecks, ForceFrame and DynaMo, enable practitioners to consistently monitor neuromuscular fatigue, strength and performance capacity, supporting objective decision-making when availability has a direct impact on outcomes.
To learn how VALD technology can help you monitor fatigue, interpret meaningful change and contextualize performance trends, get in touch with our team.
References
- Ashworth, B., Hank, M., Khaiyat, O., Coyles, G., Verbruggen, F. F., Zemkova, E., Zahalka, F., & Maly, T. (2025). Early rate of force development and maximal strength at different positions of the Athletic Shoulder Test in baseball players. Sports, 13(9), 300. https://doi.org/10.3390/sports13090300
- Dowling, B., McNally, M. P., Chaudhari, A. M. W., & Oñate, J. A. (2020). A review of workload-monitoring considerations for baseball pitchers. Journal of Athletic Training, 55(9), 911–917. https://doi.org/10.4085/1062-6050-0511-19
- Escamilla, R. F., Barrentine, S. W., Fleisig, G. S., Zheng, N., Takada, Y., Kingsley, D., & Andrews, J. R. (2007). Pitching biomechanics as a pitcher approaches muscular fatigue during a simulated baseball game. The American Journal of Sports Medicine, 35(1), 23–33. https://doi.org/10.1177/0363546506293025
- He, J., Li, M., Zhang, Q., & Zhang, Z. (2025). Associations between the performance of vertical jump and accelerative sprint in elite sprinters. Frontiers in Bioengineering and Biotechnology, 13, 1539197. https://doi.org/10.3389/fbioe.2025.1539197
- Kutscher. S., Song, Y., Wang, L., et al. (2013). Validation of a statistical model predicting possible fatigue effect in Major League Baseball [Abstract]. Sleep, 36, A408.
- Posner, M., Cameron, K. L., Wolf, J. M., Belmont, P. J., & Owens, B. D. (2011). Epidemiology of Major League Baseball injuries. The American Journal of Sports Medicine, 39(8), 1676–1680. https://doi.org/10.1177/0363546511411700
- Song, A., Severini, T., & Allada, R. (2017). How jet lag impairs Major League Baseball performance. Proceedings of the National Academy of Sciences of the United States of America, 114(6), 1407–1412. https://doi.org/10.1073/pnas.1608847114
- Thorpe, R. T., Atkinson, G., Drust, B., & Gregson, W. (2017). Monitoring fatigue status in elite team-sport athletes: Implications for practice. International Journal of Sports Physiology and Performance, 12(s2), S2-27S2-34. https://doi.org/10.1123/ijspp.2016-0434
- Winter, W. C., Potenziano, B. J., Pfeifer, P. E., et al. (2013). Predicting Major League Baseball (MLB) player career longevity via sleepiness measurements [Abstract]. Sleep.