Data-Informed Baseball Performance
Available in:
EN
Through years of athlete profiling and data collection, Ryan has developed a testing system that connects performance outcomes to training decisions and on-field pitching performance, including a velocity prediction model. We interviewed Ryan to learn more about how he integrates systems like ForceDecks and ForceFrame to profile baseball athletes, categorize movement strategies and use performance data to guide individualized programming.
How has data shaped CBC’s assessment process?
Before incorporating objective testing, CBC’s assessment process relied primarily on visual movement screens and general physical capacity testing, which often resulted in broad training recommendations. To build a more individualized approach, we expanded our assessment framework to better understand each athlete’s unique physical profile and use that information to guide more targeted training decisions.
Our current approach combines visual assessment of athlete structure with gym-based performance testing and objective measurement technologies, providing a more complete understanding of each athlete’s physical capabilities and limitations. Measurement systems such as force plates (e.g., ForceDecks) and dynamometers (e.g., ForceFrame) have enabled us to answer previously unanswered performance questions using objective data.
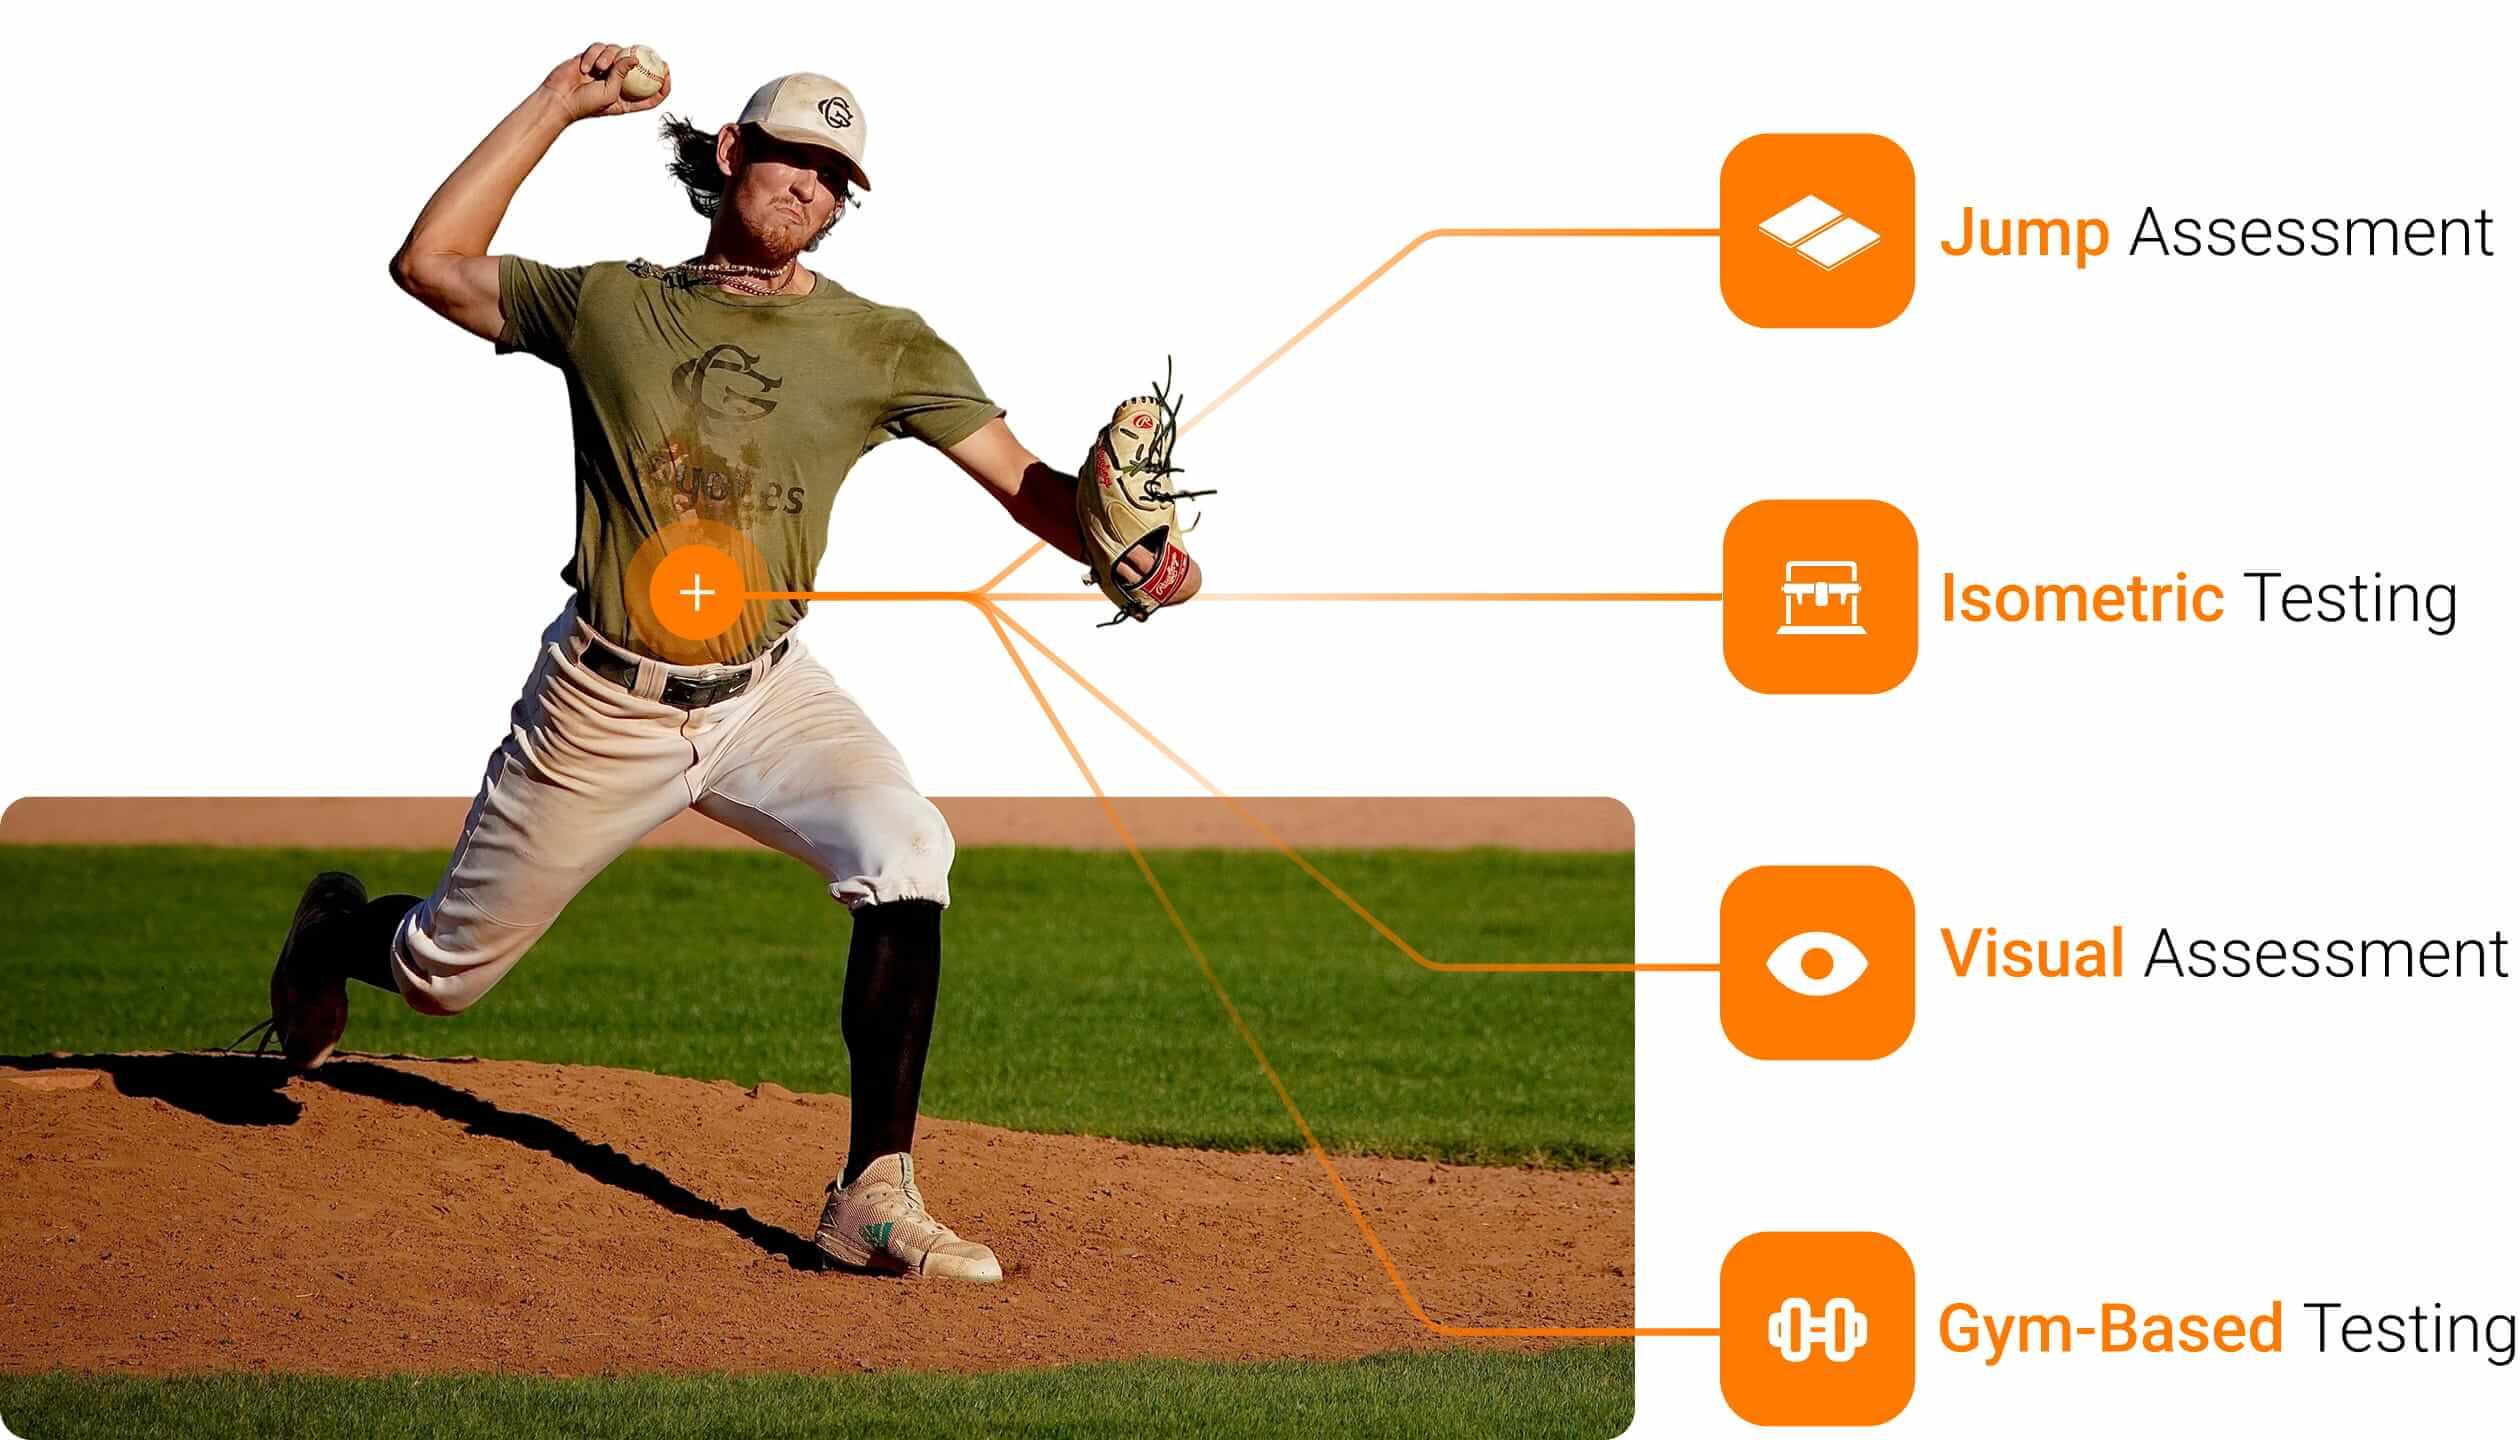
Key assessment domains used by CBC to profile pitching athletes.
For high-level athletes, the degree of individualization matters considerably more than it does at earlier stages of the development pathway, as almost all basic training adaptations have already been made. Therefore, the data collected informs programming decisions and, over time, adds to a growing database that allows for greater granularity in data-informed decision-making.
…the data collected informs programming decisions and, over time, adds to a growing database that [makes those decisions more precise].
How does CBC use data to categorize athletes?
Each athlete moves through the same sequence of assessments at intake. Structural observation screens create a working hypothesis, which is then tested against an objective battery with ForceDecks and ForceFrame. The table below outlines what is assessed and how it feeds into the broader profile.
| Assessment | System | Metrics |
| Structural Observation | Visual assessment and goniometry |
|
| Countermovement Jump (CMJ) | ForceDecks |
|
| Hip Adduction and Abduction | ForceFrame |
|
| Hip Internal and External Rotation |
| |
| Hip Extension |
|
A central feature of the profiling system is the categorization of athletes based on their CMJ strategy on ForceDecks. Using countermovement depth as an example, we can compare metric performance against our own CBC database of pro and college baseball athletes, where average countermovement depth sits around −33cm. This data allows us to categorize athletes into two broad groups:
- Elastic (−33 to −40cm): Athletes often move efficiently and rely on energy storage and return, but may require greater emphasis on eccentric strength and braking capacity development.
- Stiff (−25 to −33cm): Athletes are typically stronger and larger but often demonstrate lower pitching velocity, requiring a different training approach despite sharing similar performance deficits.
While we place significant value on concentric outputs, an athlete’s ability to express them is influenced by the quality of the braking phase. An efficient concentric phase requires the ability to rapidly absorb and control force beforehand.
While we place significant value on concentric outputs, an athlete’s ability to express them is influenced by the quality of the braking phase.
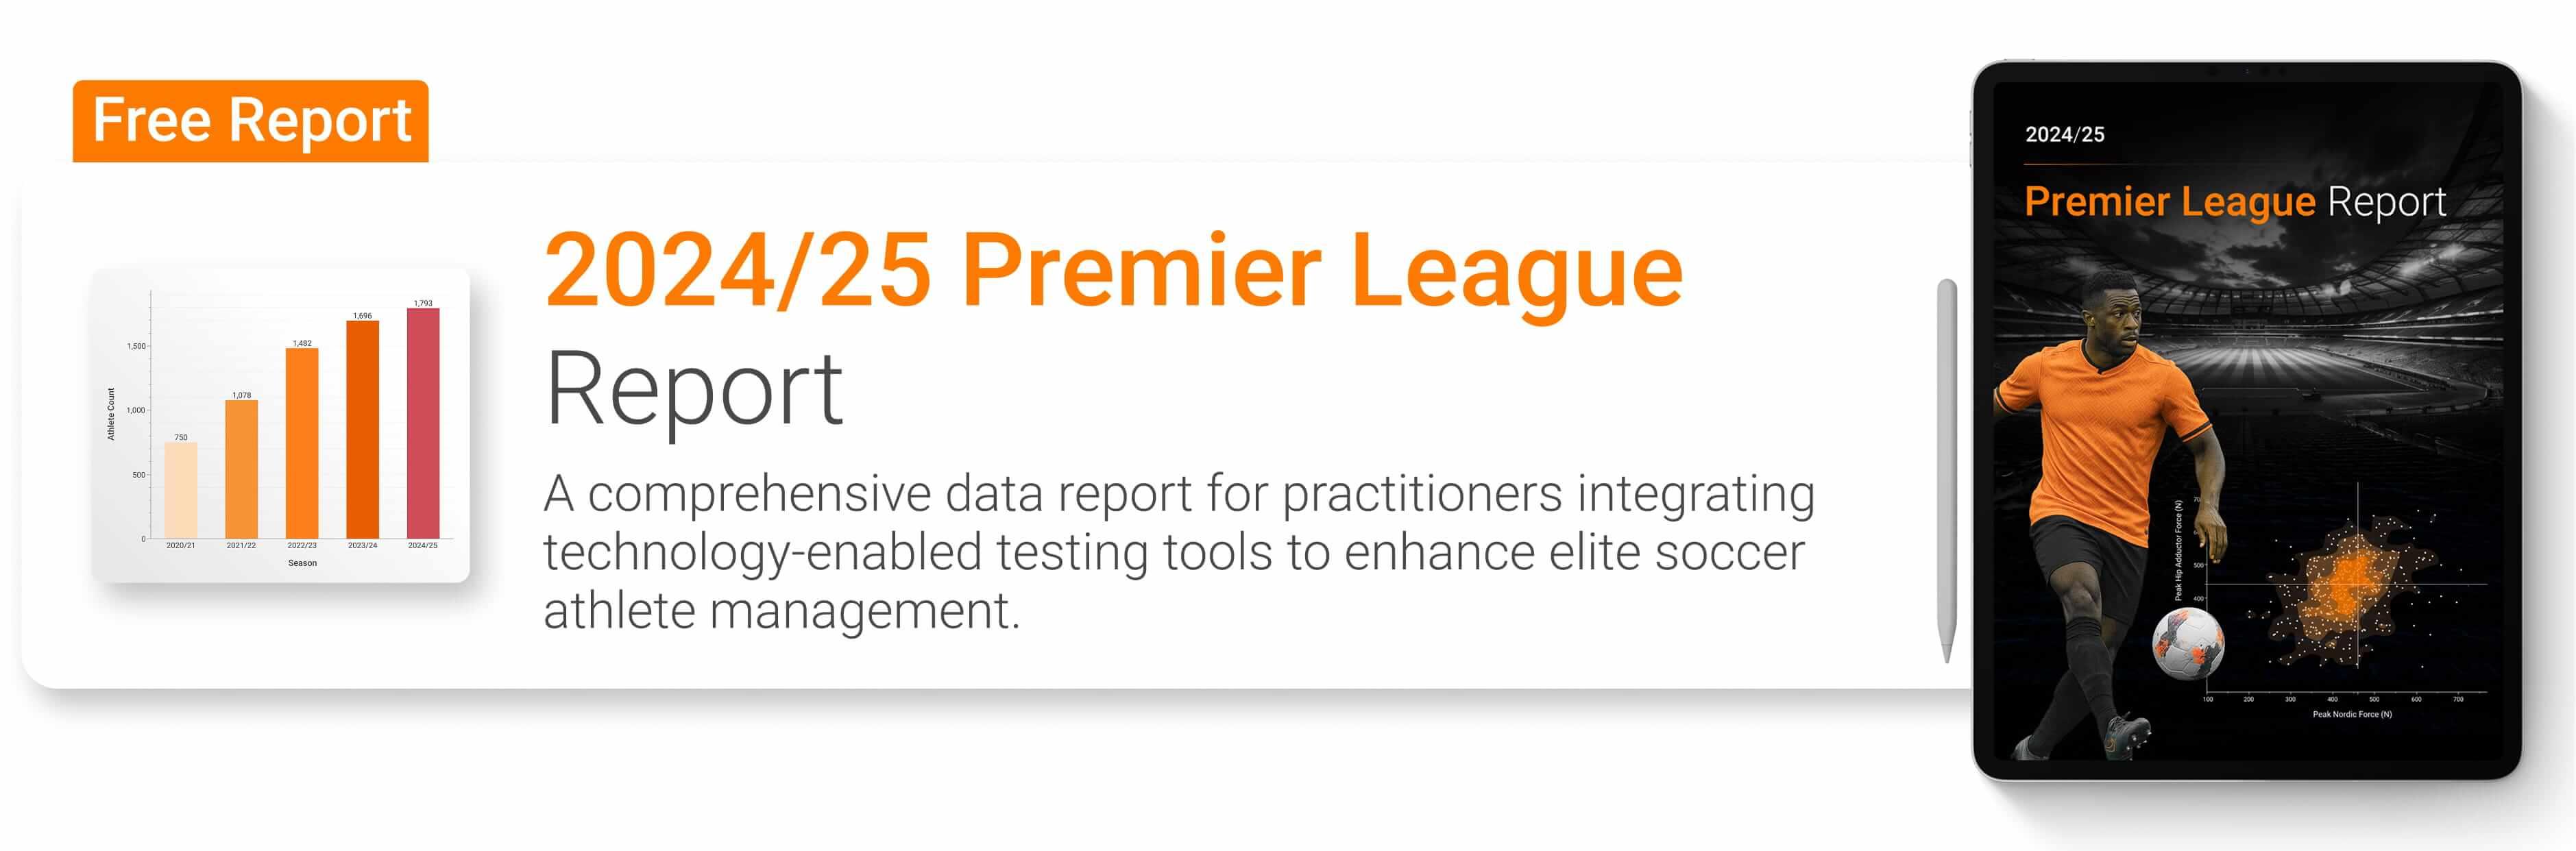
This concept extends beyond baseball and has also been highlighted in other sports data, such as the 2024/25 Premier League Report, which found that rapid concentric force production differentiated elite from sub-elite athletes.
For example, an elastic athlete demonstrating high braking RFD alongside substantial countermovement depth may be better equipped to decelerate and redirect force efficiently. On the mound, this same quality is associated with enhanced force transfer during the deceleration phase of throwing.
How does CBC predict pitch velocity?
The prediction model was built over three years of consistent data collection. For each athlete in the database, braking RFD, concentric impulse 100ms and peak power were recorded from VALD Hub and cross-referenced with measured pitching velocity.
The aim was to identify which CMJ metrics had the strongest linear relationship to pitch speed within this specific population, rather than relying on external datasets that may not reflect the testing environment or athlete profile at CBC.

Visual overview of how CBC contextualizes predicted fastball velocity using ROM, CMJ and ForceFrame data.
With a database of nearly 200 professional athletes, the model predicts pitching velocity from lower-body outputs alone and is accurate to within 2 miles per hour (mph) for most athletes. Research supports the relationship between lower-body power and throwing performance, with lower-body contribution estimated to account for a substantial portion of pitching velocity (Lehman et al., 2013).
…the model predicts pitching velocity from lower-body outputs alone and is accurate to within 2mph for most athletes.
However, prediction is not the primary output. The more useful signal is the direction of the gap between predicted and actual velocity, which directly shapes programming focus:
- Throwing Slower Than Predicted: Lower-body capacity outputs test well, but mechanical sequencing is limiting transfer to ball velocity. Programming adjustments shift toward addressing pitching mechanics.
- Throwing Faster Than Predicted: Velocity is being generated through elastic tissue properties or mechanical efficiency rather than lower-body output. Addressing lower-body strength and power capacity may support long-term durability without limiting current performance.
How does CBC factor asymmetry into testing and preparation?
Baseball athletes are not expected to be symmetrical, and the presence of an asymmetry alone is rarely a reason for intervention. Instead, the key question is whether the asymmetry is contributing to injury risk or limiting performance.
At CBC, particular attention is paid to plant-leg hip abduction and internal rotation, as deficits in these qualities may reduce the athlete’s ability to decelerate through the lead hip and increase stress further up the kinetic chain. In fact, hip abduction and adduction strength have been shown to decrease following repeated pitching, with declines in hip adduction strength associated with reduced late-game ball velocity (Yanagisawa & Taniguchi, 2018).
…hip abduction and adduction strength have been shown to decrease following repeated pitching, with declines in hip adduction strength associated with reduced late-game ball velocity.
Weakness in the hips relative to the drive leg is associated with reduced capacity to decelerate through the lead hip at ball release, which in turn increases rotator cuff stress.
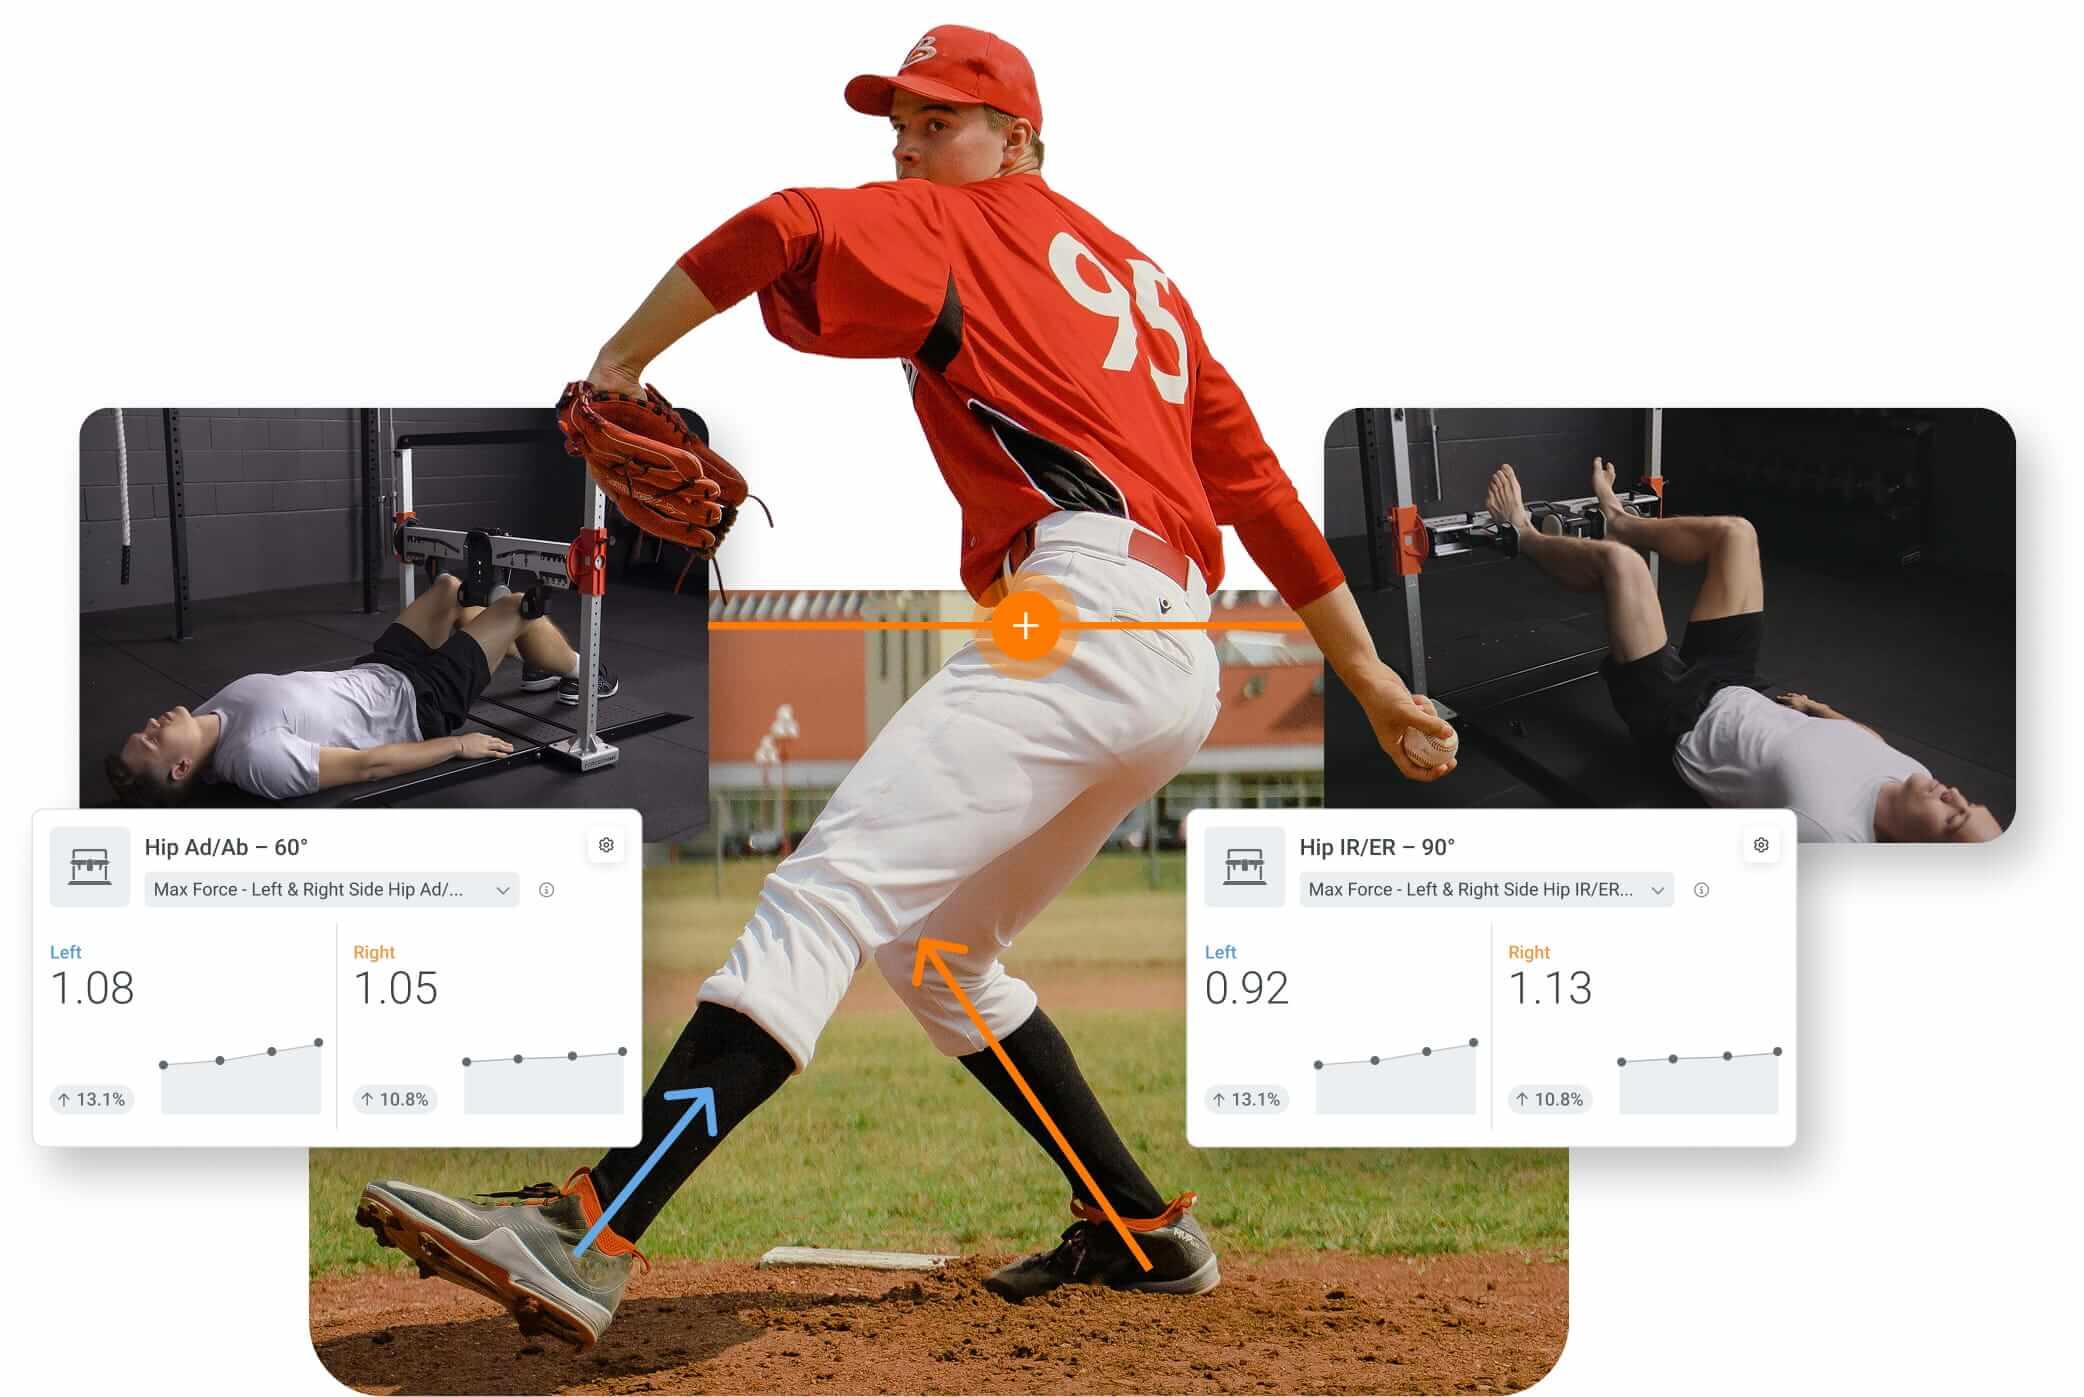
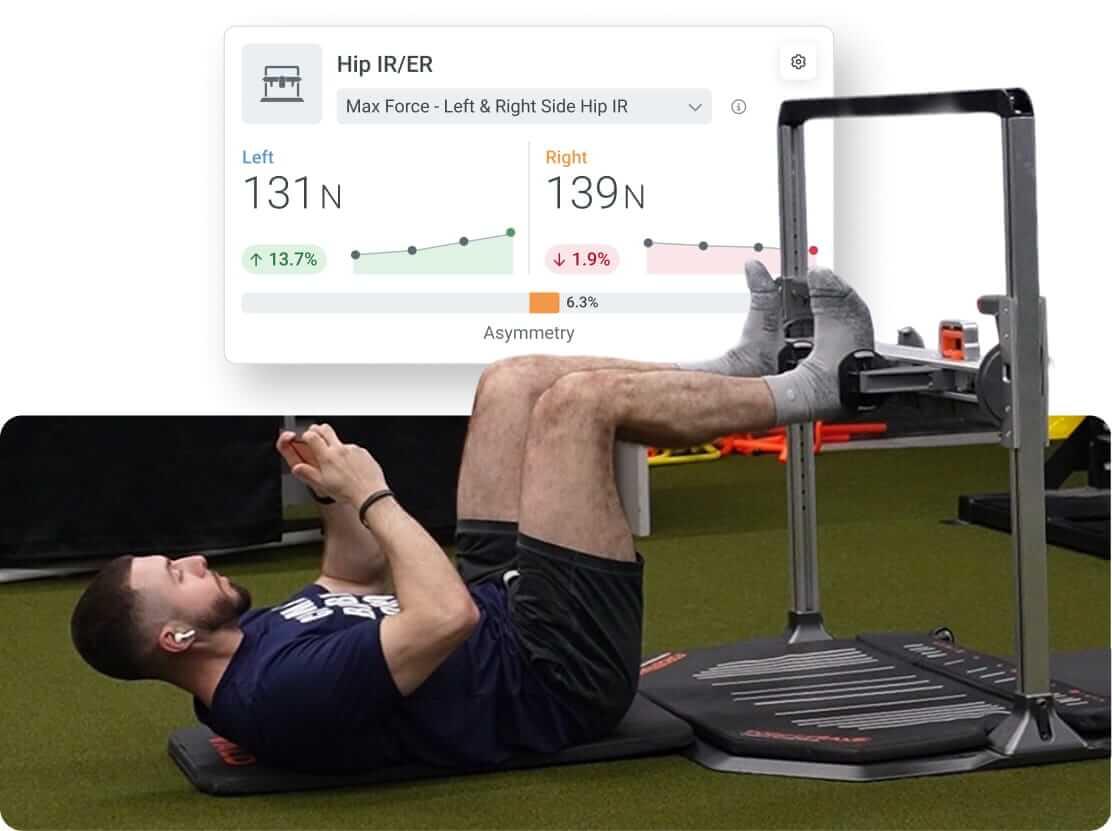
Pitching profile conducted on ForceFrame to understand hip performance and asymmetry data.
Seeing a 7-8% asymmetry in an athlete with limited injury history and consistent performance is rarely a flag for intervention. However, if that athlete has a significant, unresolved injury history despite implementing an upper-body rehabilitation plan, they may benefit from more targeted hip strengthening.
Intervention decisions are made within the context of the athlete’s injury history, performance profile and training background, recognizing that some asymmetries may represent beneficial adaptations to years of throwing rather than problems that need to be corrected.
How does your programming fit together?
Testing is a feedback loop in which structural and movement assessments set hypotheses about athletes, technology confirms or challenges them and the relationship between predicted and actual pitching velocity determines where training emphasis is placed. That loop is repeated and each iteration adds resolution to the athlete’s profile.
For elite athletes, that level of individual precision matters. What data makes possible is not just measurement, but a consistent, comparable record of how an athlete is moving, where their outputs sit and whether training is working. Over time, that record becomes the most reliable guide to what happens next.
If you would like to learn more about how VALD’s human measurement technology can help you profile athletes, guide individualized programming and connect performance data to sport-specific outcomes, get in touch with our team.
References
- Lehman, G., Drinkwater, E. J., & Behm, D. G. (2013). Correlation of throwing velocity to the results of lower-body field tests in male college baseball players. Journal of Strength and Conditioning Research, 27(4), 902–908. https://doi.org/10.1519/JSC.0b013e3182606c79
- Yanagisawa, O., & Taniguchi, H. (2018). Changes in lower extremity function and pitching performance with increasing numbers of pitches in baseball pitchers. Journal of Exercise Rehabilitation, 14(3), 430–435. https://doi.org/10.12965/jer.1836196.098
