Bridging the Gap: Using data to identify optimal loading for power development
Available in:
EN
About the Author
Antonio Squillante, PhD, MS, CSCS,*D, NSCA-CPT,*D, RSCC, SENr, is an Assistant Professor of Kinesiology at Point Loma Nazarene University and Head of Performance and Training for the Sprint Program at USA Track Cycling. He is also a member of the Board of Directors for the National Strength and Conditioning Association (NSCA). With over a decade of experience, he has coached athletes at both national and international levels.
Thank you to Carson O’Coyne for contributing to this blog. His expertise in coding, data analysis and strength training has been an asset. Carson is currently completing his Master’s in Sport Science at Point Loma Nazarene University.
Strength, Hypertrophy and Power: A Quick Overview
Resistance training intensity dictates adaptation. Strength development is best achieved with heavier loads – typically 80-90% of one-repetition maximum (1RM) – for sets of 2 to 5 reps. As strength improves, absolute loads increase while relative intensity remains consistent.
Hypertrophy protocols usually involve moderate loads near 70-75% of 1RM, performed for 10-12 reps close to failure. In this case, metabolic stress plays a greater role than the load percentage itself.
Power training, however, is more nuanced. Mechanical power is the product of force and velocity, which exist in an inverse relationship.
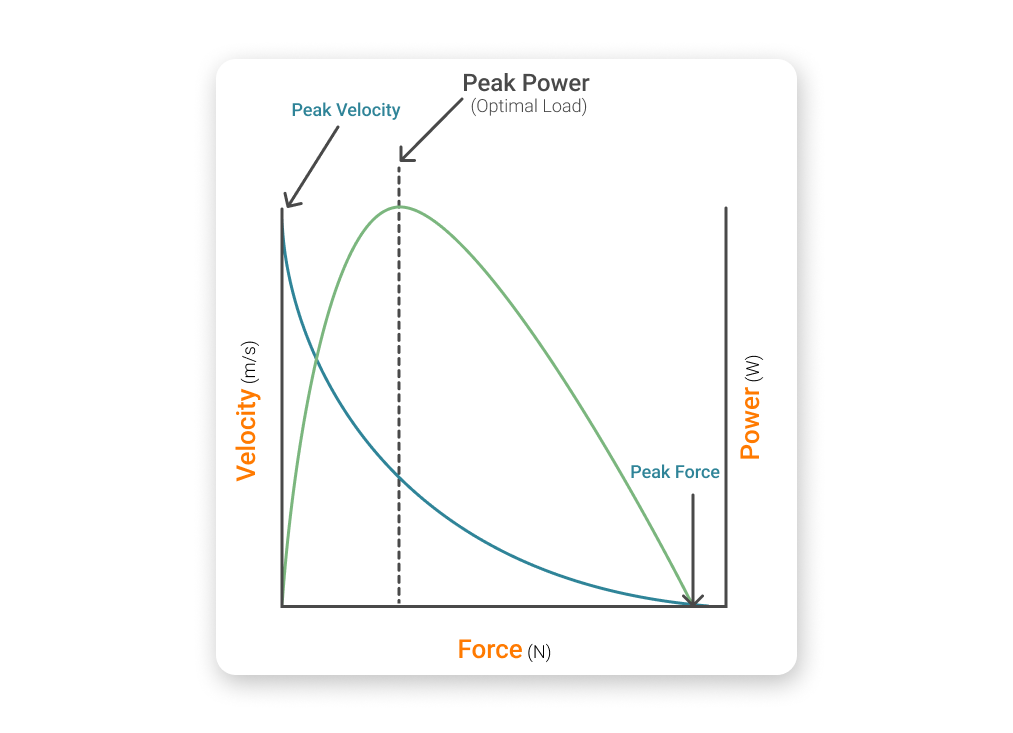
Force-velocity-power relationship of muscle on a tissue level, depicting the “optimal load” for power expression.
Traditional barbell exercises tend to produce peak power at moderate loads (45-55% of 1RM) with bar speeds around 0.8-1.0m/s. Ballistic movements like loaded jumps achieve peak power output (PPO) with lighter loads (10-20% of body weight) and higher velocities (1.8-2.2m/s). The point at which force and velocity are balanced to maximize mechanical power is referred to as the “optimal load.”
Mechanical power is the product of force and velocity… [optimal loading exists when] force and velocity are balanced to maximize mechanical power…
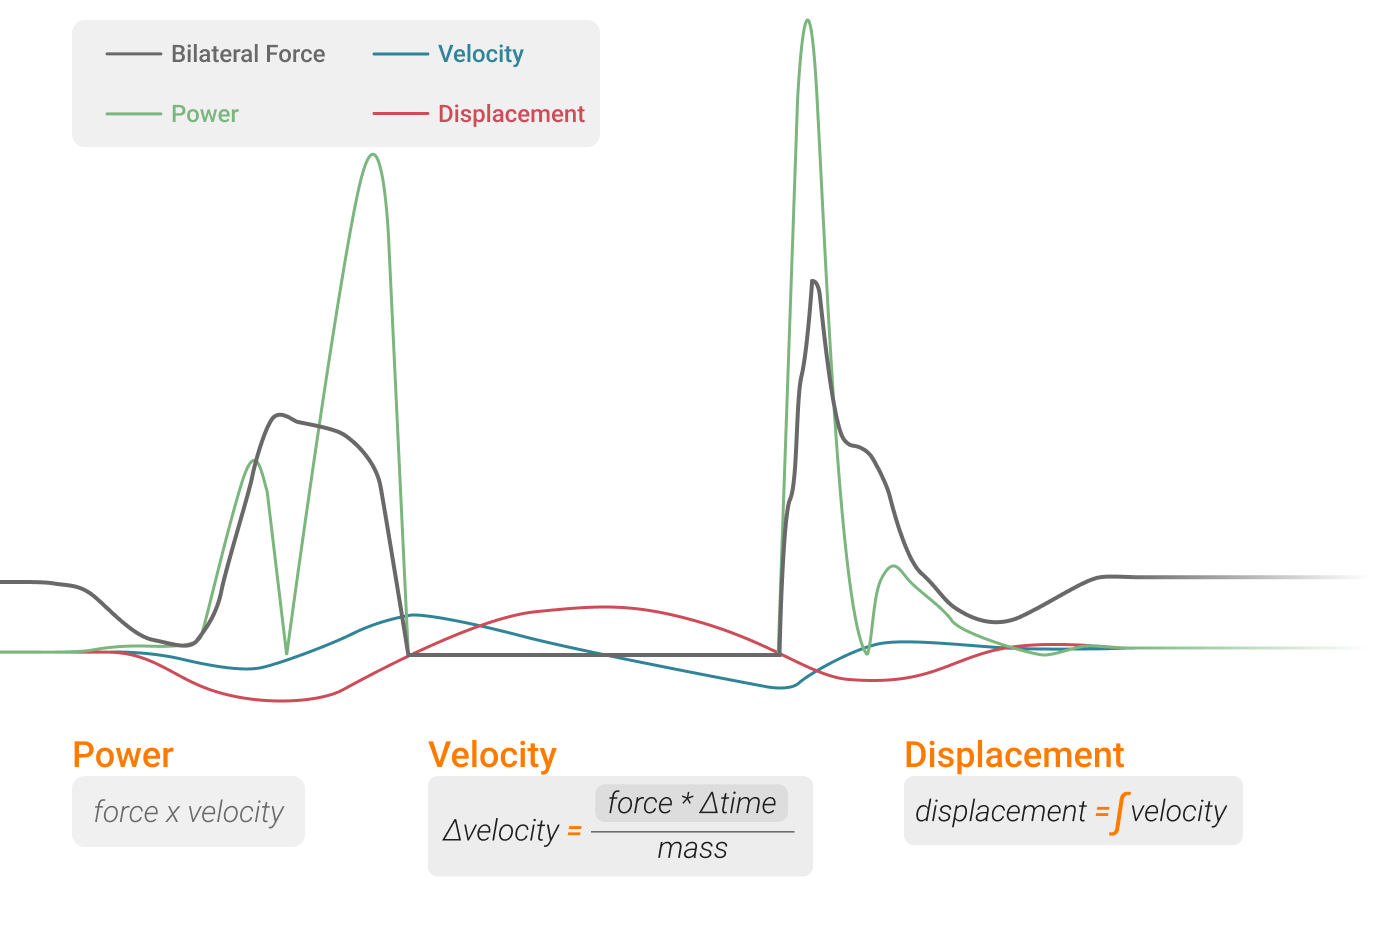
Visualizations and definitions of force, velocity, power and displacement seen in a countermovement jump assessment.
It is important to understand that training at the optimal load maximizes power expression in the moment but does not necessarily lead to long-term improvements in power development. This distinction is critical.
…training at the optimal load maximizes power expression in the movement but does not necessarily lead to long-term improvements in power development.
Just as a runner training for a 5-kilometer race will not make meaningful progress by only running at race pace, an athlete seeking to improve power output will not benefit from training exclusively at a single load – even if it is their current PPO. True performance gains come from a well-rounded program that includes a spectrum of loads and velocities, targeting different aspects of the force-velocity curve.
By systematically varying training intensity, athletes can improve neuromuscular efficiency, rate of force development (RFD) and overall capacity, ultimately leading to greater improvements in power over time.
The Role of Objective Measurement
To optimize training for power, practitioners must understand how different loads affect an athlete’s ability to produce force and velocity. Evidence suggests the most effective adaptations occur when training spans 70-120% of the load that produces peak mechanical power (Kawamori & Haff, 2004). Accurately identifying that load requires objective measurement technology, such as ForceDecks.
Force plates are among multiple technologies that allow practitioners to quantify mechanical power. They do so by measuring ground reaction forces (GRFs) and analyzing force-time constraints with other information such as the system weight (athlete body mass + external load). Other technologies, such as linear position transducers, calculate bar velocity under different loading conditions.
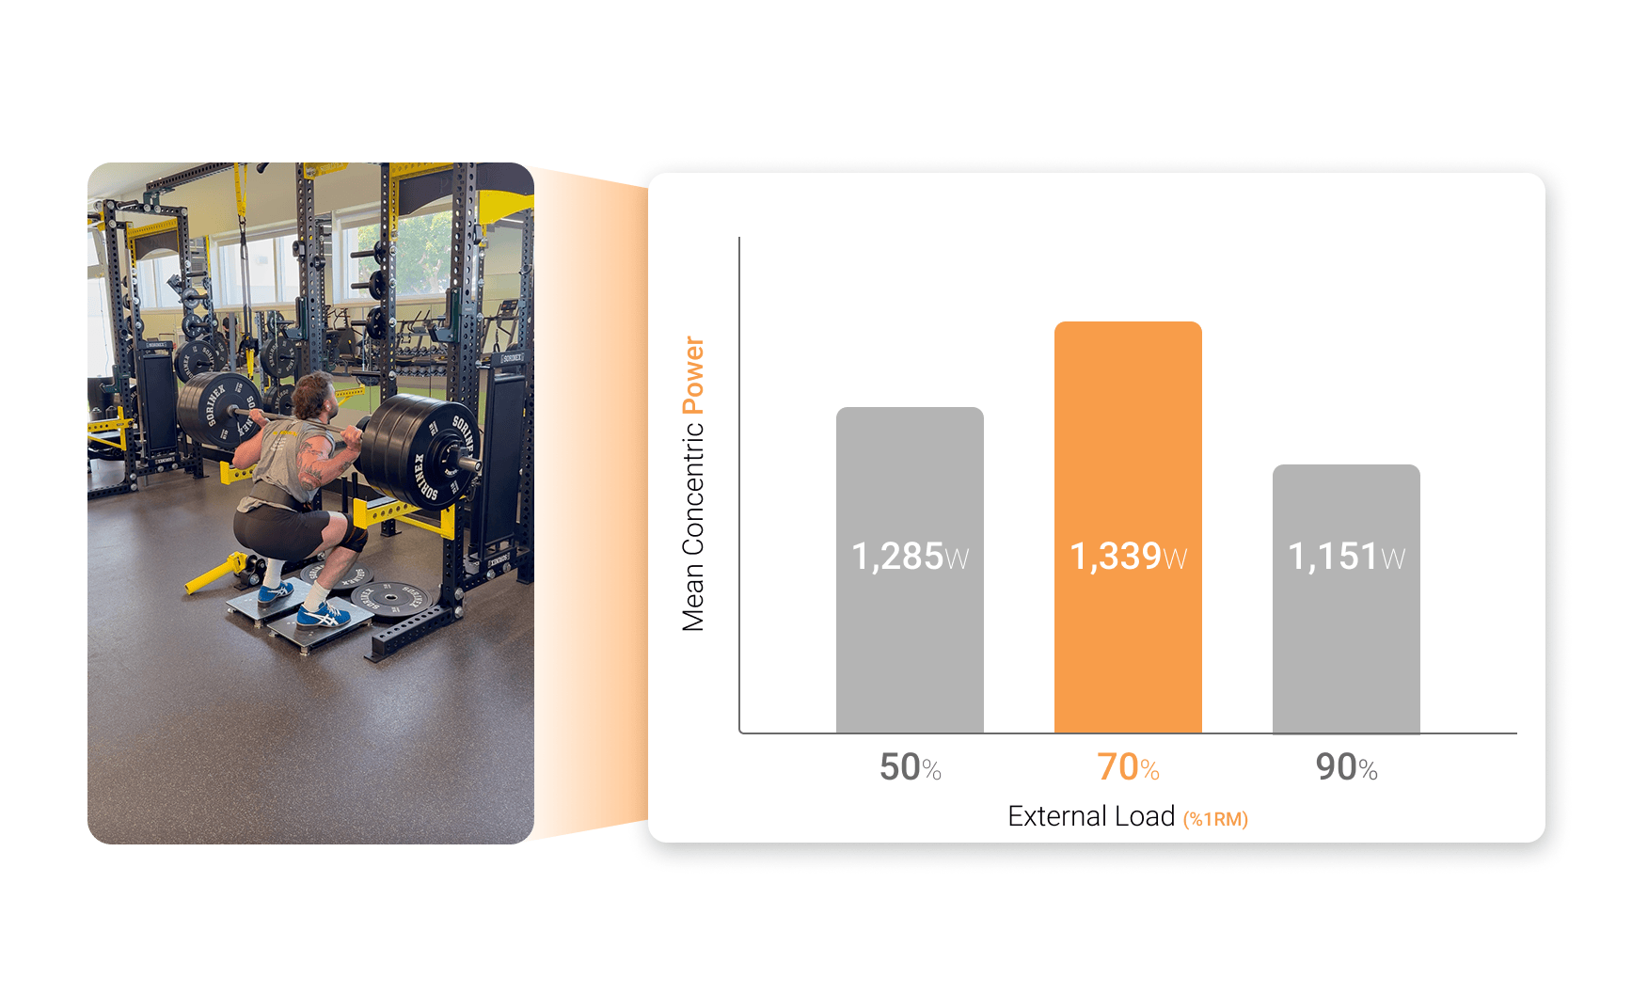
A Point Loma athlete performing a loaded squat assessment on ForceDecks, showing maximal concentric power development at 70% of their 1RM.
…[identifying] an athlete’s individual power profile …helps assess performance decline across reps or sets, providing a more complete picture of fatigue and output.
Testing at 50%, 70% and 90% of 1RM can identify an athlete’s individual power profile. This approach helps assess performance decline across reps or sets, providing a more complete picture of fatigue and output. This format mirrors velocity-based training, where athletes are given a specific velocity threshold (e.g., 0.7 m/s) or a target percentage drop in velocity (e.g., 20%). If the athlete’s bar speed falls below this threshold, the set is terminated (Pareja-Blanco et al., 2020).
Assessment
When using force plates to track power, a simple protocol might involve testing three different load conditions – such as 50%, 70% and 90% of an athlete’s 1RM – to determine which load elicits the highest peak concentric power output. This method mirrors the approach taken by Vasquez-Huot et al. (2013), who used a similar protocol to evaluate the effects of load and fatigue on power output.
In their study, participants performed sets under each loading condition in a randomized order, completing either sets to failure or sets of three reps. For each condition, the researchers recorded the number of reps completed, rating of perceived exertion (RPE) and peak concentric power output.
Power was measured at both the first and last rep of each set to assess the decline in performance over time. This dual measurement approach provided insight not only into which load produced the greatest PPO, but also how quickly performance deteriorated under different levels of fatigue, offering valuable information for tailoring training programs based on power potential and fatigue tolerance.
| Test | Reps | PPO First Rep (W/kg) | PPO First Rep (W/kg) | RPE | ||||
|---|---|---|---|---|---|---|---|---|
| Mean | SD | Mean | SD | Mean | SD | Mean | SD | |
| 50-3 | 3.0 | 0.0 | 18.4 | 5.8 | 19.0 | 6.1 | 9.5 | 1.6 |
| 70-3 | 3.0 | 0.0 | 21.1 | 5.7 | 21.9 | 5.6 | 11.7 | 1.1 |
| 90-3 | 3.0 | 0.0 | 22.1 | 6.3 | 22.1 | 5.9 | 15.3 | 1.8 |
| 50-F | 36.6 | 9.4 | 18.9 | 4.5 | 12.5 | 2.8 | 16.7 | 2.2 |
| 70-F | 15.6 | 5.0 | 20.7 | 5.9 | 12.5 | 3.6 | 16.5 | 1.6 |
| 90-F | 5.9 | 2.9 | 20.8 | 5.8 | 14.7 | 5.3 | 17.4 | 1.5 |
Table detailing performance during 3 reps at 50%,70% and 90% loads and during the fatigue protocol with the same loads.
This closely aligned with our methodology, although we expanded the analysis by corroborating data from ForceDecks with output from a linear position transducer. This dual-system approach allowed us to more precisely understand the relationship between GRFs, bar velocity and power output.
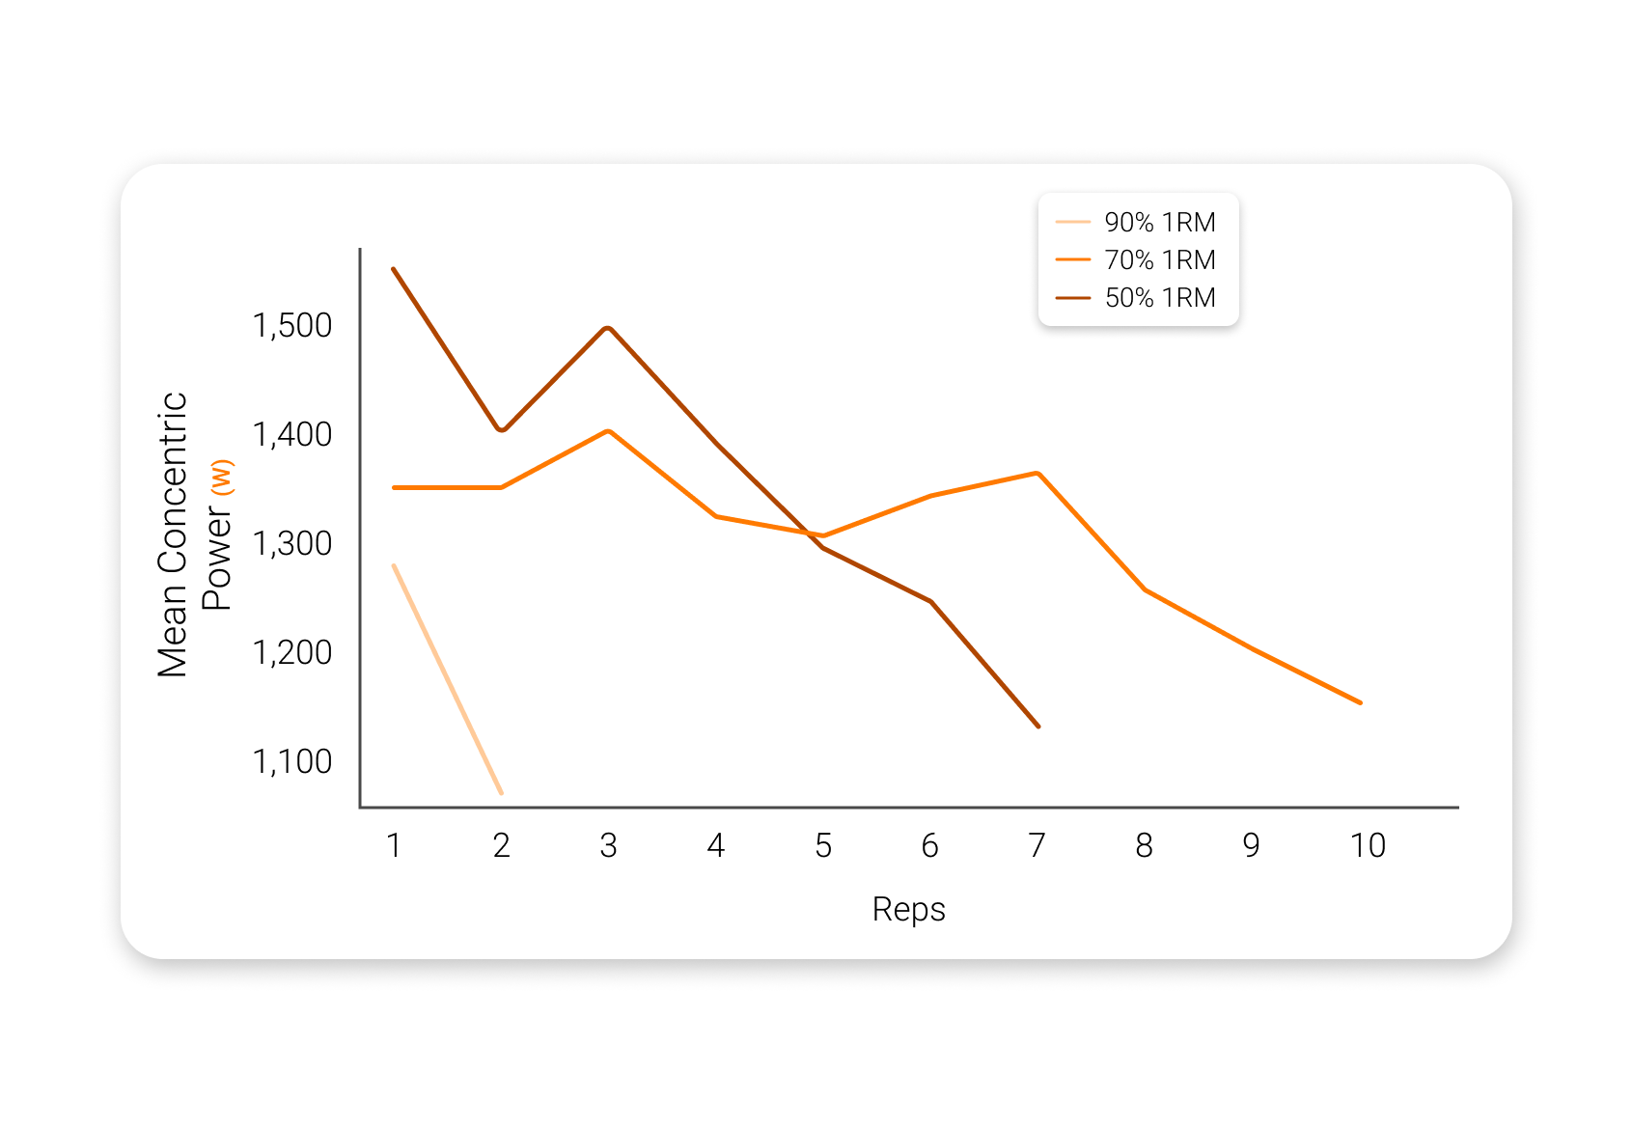
Total number of reps and mean concentric power (MCP) for 90%, 70% and 50% 1RM loads.
To minimize the confounding effects of fatigue and maintain consistent performance across reps, we applied a velocity loss threshold of 20% using the linear position transducer. This helped standardize effort across loads while preventing excessive fatigue accumulation.
By capturing concentric MCP, vertical GRFs and bar velocity simultaneously, we developed a more comprehensive profile of how each load influenced mechanical power…
By capturing concentric MCP, vertical GRFs and bar velocity simultaneously, we developed a more comprehensive profile of how each load influenced mechanical power output, enabling us to make more informed decisions about training prescriptions based on real-time, multi-modal data.
| Load | Rep | MCP (W) | Peak Vertical Force (N) | Peak Concentric Velocity (m/s) |
|---|---|---|---|---|
| 50% | 1 | 1,331 | 2,163 | 0.81 |
| 2 | 1,331 | 2,286 | 0.74 | |
| 3 | 1,384 | 2,306 | 0.79 | |
| 4 | 1,304 | 2,285 | 0.77 | |
| 5 | 1,286 | 2,279 | 0.72 | |
| 6 | 1,323 | 2,287 | 0.73 | |
| 7 | 1,344 | 2,326 | 0.78 | |
| 8 | 1,235 | 2,279 | 0.71 | |
| 9 | 1,180 | 2,264 | 0.65 | |
| 10 | 1,129 | 2,273 | 0.64 | |
| 70% | 1 | 1,536 | 2,990 | 0.6 |
| 2 | 1,381 | 2,900 | 0.53 | |
| 3 | 1,482 | 2,983 | 0.6 | |
| 4 | 1,371 | 2,952 | 0.6 | |
| 5 | 1,274 | 2,904 | 0.62 | |
| 6 | 1,224 | 2,896 | 0.51 | |
| 7 | 1,108 | 2,558 | 0.47 | |
| 90% | 1 | 1,257 | 3,592 | 0.49 |
| 2 | 1,045 | 3,499 | 0.37 |
Interpreting the Results
Results from our lab, along with findings from previous research (Soriano et al., 2015), consistently demonstrate that concentric peak power is often achieved around 70% of 1RM, especially in trained athletes. This challenges the more traditional 30-60% 1RM range commonly cited in earlier literature, some of which was based on untrained or mixed populations.
A Point Loma athlete performing a squat assessment with average MCP displayed.
The implication is significant: to truly optimize power development, athletes may need to train with heavier loads than what has historically been recommended. While meta-analyses provide a useful starting point for general programming, they often lack the nuance required for individualization.
…to truly optimize power development, athletes may need to train with heavier loads than what has historically been recommended.
In contrast, real-time data captured through technologies like force plates offers practitioners the ability to tailor load prescriptions with much greater accuracy, ensuring each athlete is training at the load that maximizes their power output in real time.
Tools such as ForceDecks play a critical role in this process, providing precise and objective measurement of key variables such as ground reaction force, RFD and concentric power output. Without access to this level of detail, practitioners are left to rely on estimations or subjective indicators, which can lead to suboptimal load selection and missed opportunities for adaptation.
ForceDecks enables practitioners to profile each athlete’s power output across a range of loads, monitor changes over time and adjust programs based on measurable responses. This level of granularity is essential not only for maximizing adaptation but also for ensuring that athletes are training with purpose and efficiency.
Moving Toward Individualized Prescriptions
Practitioners often rely on average trends to guide loading. However, averages do not reflect individual needs. Objective technology makes it possible to tailor training to each athlete, identifying their unique load for PPO and refining prescription ranges with confidence.
By combining data from force plates with traditional strength programming, coaches and practitioners can create targeted strategies that align with each athlete’s force-velocity profile – bridging the gap between research and practice.
To learn more about how ForceDecks can help assess power output across different loads and inform more individualized training decisions, please reach out.
References
- Kawamori, N., & Haff, G. G. (2004). The optimal training load for the development of muscular power. The Journal of Strength & Conditioning Research, 18(3), 675–684. https://doi.org/10.1519/1533-4287(2004)18%3C675:totlft%3E2.0.co;2
- Pareja-Blanco, F., Alcazar, J., Sánchez-Valdepeñas, J., Cornejo-Daza, P. J., Piqueras-Sanchiz, F., Mora-Vela, R., Sánchez-Moreno, M., Bachero-Mena, B., Ortega-Becerra, M., & Alegre, L. M. (2020). Velocity loss as a critical variable determining the adaptations to strength training. Medicine & Science in Sports & Exercise, 52(8), 1752–1762. https://doi.org/10.1249/mss.0000000000002295
- Soriano, M. A., Jiménez-Reyes, P., Rhea, M. R., & Marín, P. J. (2015). The optimal load for maximal power production during lower-body resistance exercises: A meta-analysis. Sports Medicine, 45, 1191–1205. https://doi.org/10.1007/s40279-015-0341-8
- Vasquez, L. M., McBride, J. M., Paul, J. A., Alley, J. R., Carson, L. T., & Goodman, C. L. (2013). Effect of resistance exercise performed to volitional failure on ratings of perceived exertion. Perceptual and Motor Skills, 117(3), 881–891. https://doi.org/10.2466/27.29.pms.117x30z