How to use VALD's Excel monitoring dashboard template
Available in:
EN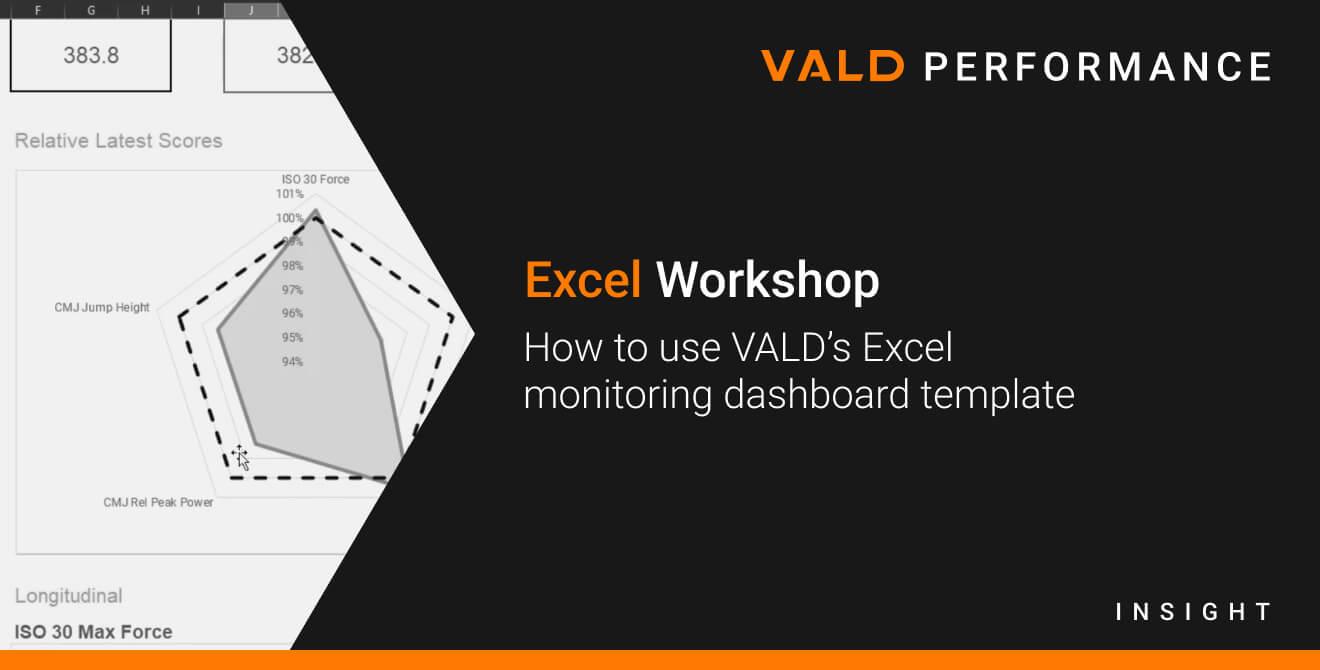
This one is for the Excel lovers. We recently did a LinkedIn and Twitter poll on your favourite platform for interacting with your VALD systems data, and Excel was voted No.1.In response to the poll, our Data Scientist Nick Murray has created a mini workshop / tutorial, whic
h explores a Microsoft Excel dashboard template we have created (download here). There are countless ways to both analyse and visualise your data, including VALD Hub itself with our latest release. We encourage you to explore these options from which you can build upon to suit your use case.This template uses examples from three common monitoring tests, across three different technologies, which you can also analyse on VALD Hub:
- ISO 30° using the NordBord
- Hip Adduction using the ForceFrame
- Countermovement Jump using the ForceDecks
See the video below for a guide on how you might like to analyse your data to suit your needs.
Watch now: How to use Excel monitoring dashboard template
Video summary:In this video, VALD Data Scientist Nick Murray explores different examples of ways to analyse monitoring data collected using multiple VALD technologies.This report should only be viewed as a starting template to guide some initial thoughts on how you can view monitoring data using VALD technology. There are countless ways to view and visualise this data, so feel free to play around and use this template as you see fit.
Instructions:
- Download the template here
- Export data from VALD Hub
- Copy and paste the whole selection into the respective tab (i.e. NordBord export into NordBord tab, etc.)
Note: The graph data for both tabs should populate automatically.However there are some custom inputs you can change:
- The number of days you would like to look back to include
- The flag percentage you would like to set
- Whether you would like to compare with the ‘Average’ or ‘Max’ of a selected period
Log in to VALD Hub
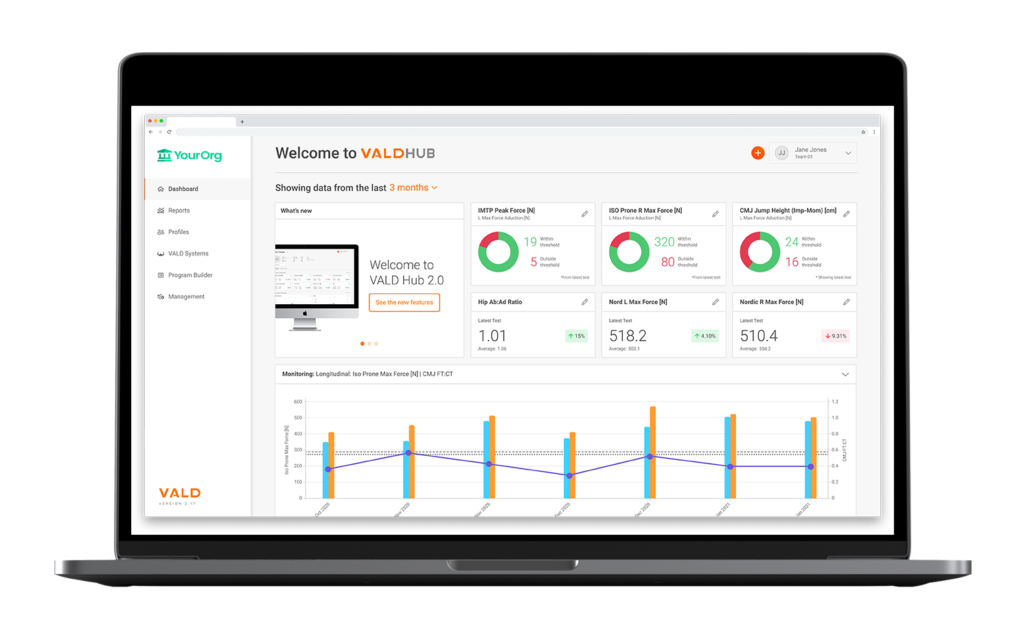
VALD Hub is the central data and administration platform for your NordBord, ForceFrame and ForceDecks.
Profile management:
Improved understanding of your clients. Reviewing your client data is now easier and more informative than ever. Quickly navigate to our newly created profile screen, gaining instant insight into your clients’ rehabilitation progress.
Enhanced reporting:
Facilitating easier analysis of your data. Configure your reports to display metrics and data visualisations most pertinent to your needs.
Want to learn more about Hub? See our latest blog, or log in below.